In this case study, the author analyzed, predicted, and interpreted a type 2 diabetes (T2D) patient’s hemoglobin A1C variances based on seven periods data utilizing the GH-Method: math-physical medicine approach.
As shown in Figure 1, there are eight hemoglobin A1C check-up results:
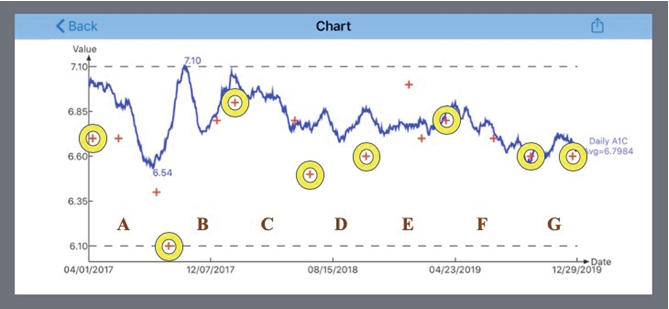
Figure 1. HbA1C during a long period of 4/1/2017 through 12/20/2019
6.7% on 4/9/2017
6.1% on 9/12/2017
6.9% on 1/26/2018
6.5% on 6/29/2018
6.6% on 10/22/2018
6.8% on 4/4/2019
6.6% on 9/25/2019
6.6% on 12/20/2019
The author selected seven periods of almost equal length with about five months each and then observed their measured A1C changes (variances) against the previous period as follows:
Period A (4/1/2017 - 8/31/2017): -0.6%
Period B (9/1/2017 - 1/31/2018): +0.8%
Period C (2/1/2018 - 6/30/2018): -0.4%
Period D (6/29/2018 - 10/22/2018): +0.1%
Period E (10/22/2018 - 4/4/2019): +0.2%
Period F (4/4/2019 - 9/25/2019): -0.2%
Period G (9/25/2019 - 12/20/2019): +0.0%
He applied his developed GH-Method: math-physical medicine (MPM approach) to analyze the following seven contribution factors of A1C:
1. A1C variances contributed by FPG (between 15% to 35% contribution).
2. FPG variance due to weight change (77% contribution).
3. Colder weather impact on FPG (each degree of Fahrenheit decrease caused 0.3 mg/dL decrease of FPG).
4. A1C variances contributed by PPG (between 65% to 85% contribution).
5. PPG variance due to carbs/sugar intake (~39% weighted contribution on PPG).
6. PPG variance due to post-meal walking (~41% weighted contribution on PPG).
7. Warm weather impact on PPG (each degree of Fahrenheit increase caused 0.9 mg/dL increase of PPG).
It should be noted that his developed mathematical HbA1C prediction model is based on different weighted ratio for the previous 4-month glucose data, instead of the standard “A1C as the three-month average glucose”.
Based on the author’s numerous publications of HbA1C contributions by FPG and PPG, along with the prediction models of these two glucoses and HbA1C, Figure 1 show a summarized chart of these A1C values over 7-periods. Figure 2 and 3 depict weight, carbs intake, exercise, FPG, PPG, daily glucose, and A1C of Period G (9/25/2019-12/20/2019). Figure 4 shows the step-by-step calculation table of all periods on how to derive and interpret these A1C variances.
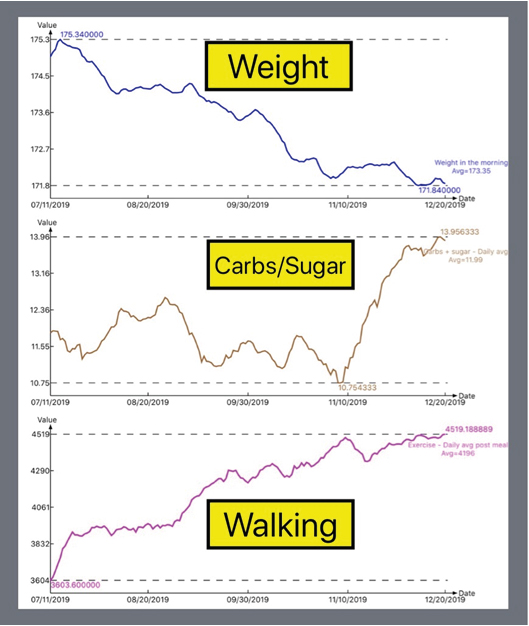
Figure 2. Weight, carbs intake, and post-meal walking (9/25/2019 - 12/20/2019)
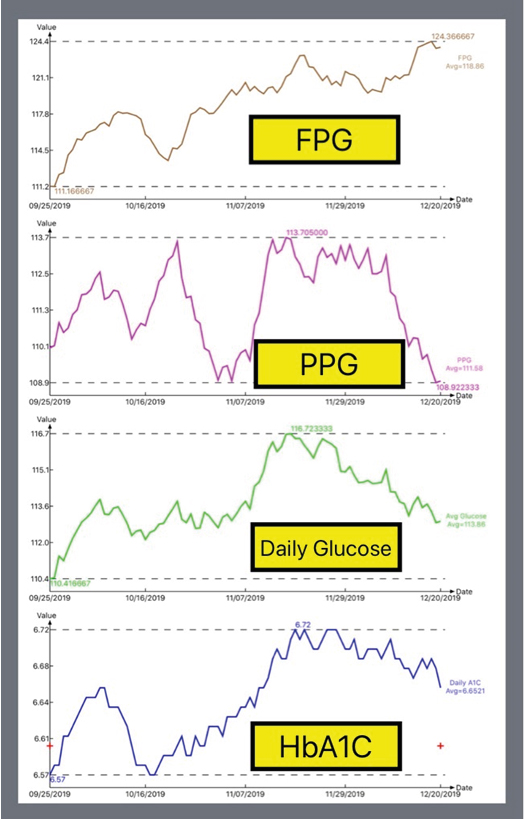
Figure 3. FPG, PPG, Daily Glucose, and A1C (9/25/2019 - 12/20/2019)
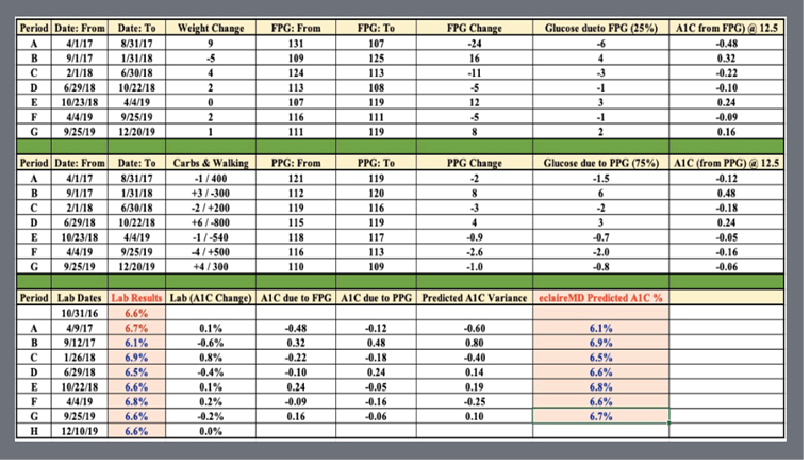
Figure 4. HbA1C step-by-step calculation table during 7-periods (4/1/2017 - 12/20/2019)
As shown in Figure 4, his predicted A1C variances completely match the test results from the laboratory for Period A through Period F. The reason for the 100% match of the eclaireMD predicted A1C and Lab-tested A1C for periods A through F is that the Lab-tested A1C has a single decimal and eclaireMD predicted A1C has two decimals.
For Period G (from 9/25/2019 to 12/20/2019), the Lab A1C is 6.6% while the predicted A1C is 6.7% (actually 6.66%). The eclaireMD predicted A1C has achieved up to 99% accuracy. During Period G, the A1C incremental amount of 0.06 is mainly resulted from the FPG increase. As shown in Figure 5, the usual high correlation (77%) existing between weight and FPG (1/1/2014-12/20/2019) was not found for this particular Period G. In addition, Period G only has duration of 3-months instead of 5-months and it was tested at a different hospital which may have different operating procedures. Therefore, the author will review this predicted A1C against the newly tested A1C around 2/25/2019. It definitely warrants a deeper investigation by the author for this period.
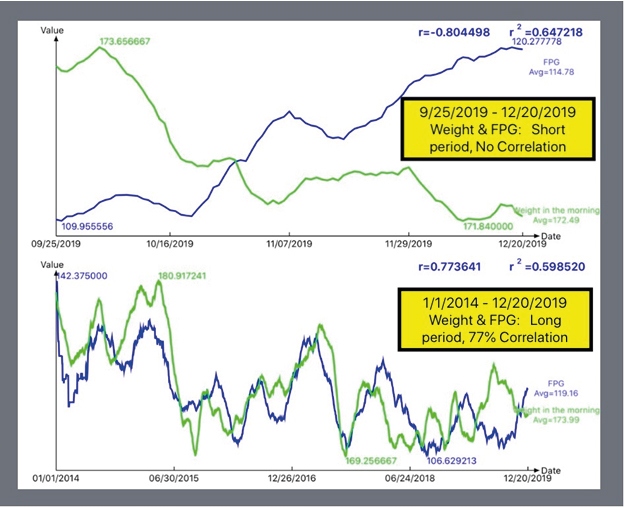
Figure 5. FPG vs. Weight for long period (4/1/2017-12/20/2019) and Period G (9/25/2019-12/20/2019)
The A1C case study focused on seven periods within 994 days. It contains 2,982 meals data, including key contribution factors such as carbs/sugar intake, post-meal exercise, weather, and more. This study has demonstrated a high degree of accuracy for the calculation and prediction of the patient’s forthcoming A1C value by using the GH-Method: math-physical medicine (MPM) approach. Once the healthcare professionals and T2D patients understand and learn this skill for the HbA1C prediction method, the patient’s overall T2D condition can then be more easily under control. The purpose of this research paper is to help them to prevent further damage to their internal organs caused by high HbA1C, while waiting to take a laboratory test.
On a side note, if some of the healthcare professionals and diabetes patients have interest to delve deeper regarding the formation of tested glucose and mathematical predicted HbA1C (hereafter, it is known as “A1C”), they should focus on the influential factors and their respective weighted contribution percentages listed in the Method section.
1. The most important month which contributes to the A1C is the closest month prior to the A1C test.
2. PPG controls A1C (> 2/3).
3. Body weight controls 77% or more of the FPG (keeping BMI < 25).
4. Carbs/sugar amount contributes 39% of PPG (safer if below 15 grams).
5. Post-meal walking steps contribute 41% of PPG (safer if walking 4,000 steps).
6. A combined effort of diet and exercise controls 80% of PPG.