In this paper, the author describes his research results of comparing the associated energy of glucose between liquid meals versus solid meals. This energy difference is resulted from his previous discovery of a hypothetical neural communication model between the brain’s cerebral cortex and certain internal organs such as the stomach, liver, and pancreas. Applying frequency domain analysis technique, his new finding of differences of associated energy via postprandial plasma glucose (PPG) provides further evidence of possible impact or damage on human organs resulted from the origins of these two different meals.
The author used his collected meal database for the past 2+ years to extract a sub-dataset of 70 liquid egg drop soup meals from 12/30/2019 to 6/4/2020 and 65 solid pan-fried egg meals from 5/11/2018 to 6/4/2020. From this extracted sub-dataset, he calculated his average finger PPG, sensor PPG, carbs/sugar amount, and post-meal walking steps, along with a synthesized PPG waveform covering 180-minutes (or 3-hours) time frame, for these two meal types respectively [1]. He has also presented these glucose data via a Candlestick chart which provides five prominent data for each PPG waveform [2, 3].
He has collected his glucose data via a continuous glucose monitor (CGM) sensor device from 5/5/2018 through 6/4/2020 at ~76.5 glucose data per day. During the 2+ year period (761 days), he has compiled a total of 58,217 glucose data. After the first bite of each meal, he measured his PPG data every 15 minutes for a period of three hours.
He focused on investigating the relationship between different food inputs such as meal nutritional contents, cooking methods, physical phases, and different glucose outputs, i.e. PPG “waveforms” (post-meal glucose “curves”). When he observed the different physical phenomenon of glucose waves from both liquid and solid food, he wondered why two different types of meals would present two different PPG waveforms with identical input of food nutritional ingredients. Most of his medical associates in the fields of internal medicine and food nutrition have mentioned that food nutritional components, particularly carbohydrates and sugar amount, and exercise influence PPG values the most. Therefore, he decided to conduct an experiment of eating meals with the same food ingredients but prepared by using two different cooking methods, resulting in two distinct physical phases. It should be noted that he has kept the intensity and duration of his post-meal exercise at the same level. This constant level of exercise keeps the equation in a simple form with a “single” primary influential factor, the food material. However, his recent research results revealed that the physical phase of food is just as significant as food ingredients.
By 2/11/2020 with ~30 meals for each category, liquid and solid, he discovered the vast differences existing between these two types of meals. He then formed a hypothetic neural communication model between the brain and certain internal organs via our nervous system. At the beginning of June 2020, using a “larger size” of similar sub-dataset, he tries to verify his established neural communication model with the path of an ”ascending” message of physical food phase from stomach to brain. After the brain processes this arrival information, then a “descending” message from the brain to both the liver and pancreas about glucose and insulin. Since February 2020, the author has tried to find a proper interpretation of his observed physical phenomena by establishing a few mathematical models, processing them through big data analytics, and then utilized physics to search for a meaningful and reasonable interpretation of these findings.
On 5/29/2020, his friend, Dr. Deborah Zelinsky, a research scientist and optometrist, who specializes in the area of interaction among the ear, eye, and brain, forwarded him an article [4].
Here is an Excerpt
Published May 18 in the Proceedings of the National Academy of Sciences, an important world first, a study co-authored by Dr. Levinthal and Dr. Peter Strick, both from the Pitt School of Medicine, has explained what parts of the brain’s cerebral cortex influence stomach function and how it can impact health. Dr. Peter Strick is a world leader in establishing evidence that internal organs are strongly modulated at the highest levels by the cerebral cortex. It’s been traditional in biology and medicine that the internal organs are self-regulatory through the autonomic nervous system, largely independent of higher brain regions. Dr. Strick’s previous research, for instance, also showed that similar areas of the cerebral cortex also control kidney and adrenal function. That course of research now could extend to “the heart, liver and pancreas to discover more about how the brain coordinates control of internal organs,” said Mr. Sterling who holds a Ph.D. in neuroscience. When it comes to trusting your gut, it already is well-established that the stomach and gut send “ascending” signals to the brain in a way that influences brain function. But the study has found that the “central nervous system both influences and is influenced by the gastrointestinal system.” What people haven’t understood to date, Dr. Strick said, is that the brain also has “descending influences on the stomach” with various parts of the brain involved in that signaling, including those areas that control movement and emotions. Those areas control the stomach “as directly as cortical control of movement. These are not trivial influences.”
On May 27, 2020, David Templeton, a writer for the Pittsburgh Post-Gazette presented an informative medical discovery report. It described exactly what the author hypothesized and felt for almost a year about the neural communication model between the brain and other internal organs. The author, by training, is a mathematician, physicist, and engineer, but not a medical doctor or a neuroscientist. He needs some evidences from other biomedical research reports to support his own hypotheses using math-physical medicine methodology.
In late 2019, he used selective words such as hypotheses, guess, and might be to describe his initial findings, but now he has located some support and proof from the work by other scientists, especially neuroscientists and brain experts. It has been an exciting process to verify his work step by step like peeling off an onion layer by layer.
Since he has already published a few articles along this line of thought in early 2020, using various food and glucose data, he will forgo some explanations and go directly into this similar conclusion but based on a “double-sized” experimental data. However, in this article, he will provide a more in-depth finding of associated energy levels (in a “relative” sense) with glucoses of these two types of meals.
From the math-physical medicine research methodology viewpoint [5], initially, he collected and displayed his “time-domain” data results, which represents the horizontal x-axis as time (in day) and the vertical y-axis as glucose (in mg/dL) - similar to an EKG chart for the heart. Next, he utilized a mathematical algorithm based on “Fourier Transform” technique to convert these time domain data into frequency domain data. In the frequency domain chart, the x-axis becomes frequency, instead of time, and the y-axis becomes the amplitude scale associated with distinctive frequency, instead of glucose scale. In one of his published paper [1], he proved that this frequency domain’s y-axis value actually indicates the “relative” energy associated with that particular glucose frequency on x-axis. Based on this frequency domain data chart, he could then segregate the total data of frequency domain into three frequency sub-ranges of low, medium, and high or just two ranges of low frequency versus high frequency.
In the glucose related frequency domain diagram, we can see that its waveform (or curve) pattern is a symmetric salad bowl shape with the high edge on each rim. Let us focus on the left half portion of the chart. The far left side indicates the lower-frequency range, those much higher glucose energy values associated with lower frequencies of glucose components (lower happening times of glucose), while the center portion specifies the higher-frequency range, those much lower glucose energy values associated with higher frequencies of glucose components (higher happening times of glucose). Once he calculated the associated energy level with PPG, he can then distinguish the energy impact on human internal organs between liquid egg food versus solid egg food.
In this particular study, he has focused on the following two specific meal categories which involved eggs only. The main difference between these two “egg alone” meal categories is the cooking method. From Figure 1, one large egg contains mainly proteins (6.3g) and fat (5g), and small amount of carbohydrates (0.38g) and sugar (0.38g). It should be noted that he occasionally takes two eggs, adds some chopped spring onions for flavor, or adds a small amount of seaweed for iodine.
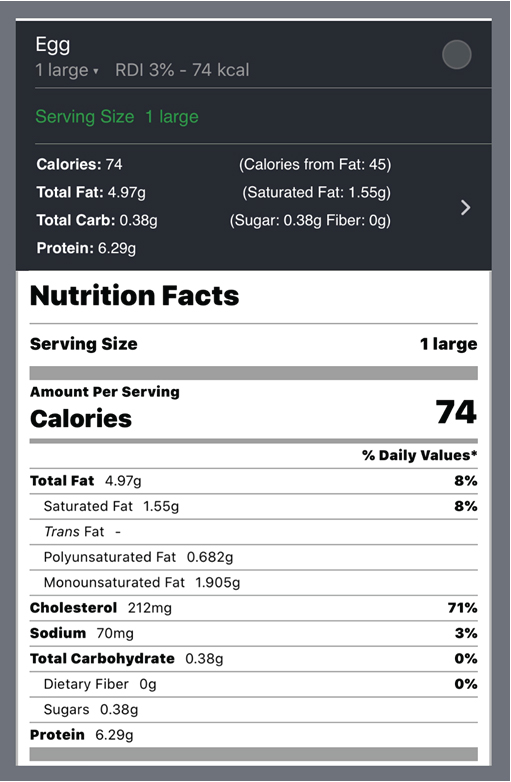
Figure 1. Nutrition Ingredients of One Large Egg
In his first category, he ate 65 pan-fried egg “solid shape” without any other contents with carbs/sugar ingredients. This “solid phase” of pan-fried eggs has an average carbs/sugar amount of 3.3 grams. His average post-meal walking steps is 4,793. His average solid finger PPG is 112 mg/dL and solid sensor PPG is 133 mg/dL (19% higher than finger and 21 mg/dL of PPG difference).
In his second category, he ate 70 egg drop soup meals (pouring mixed eggs into boiling hot water to slowly make thin-layered egg “clouds or sheets” in the soup). This “liquid phase” of egg drop soup has the exact same type and amount of nutritional ingredients as the pan-fried “solid phase” egg meals, which contains only protein and fat without any significant carbs/sugar. This “liquid phase” egg drop soup has an average carbs/sugar amount of 2.1 grams. His average post-meal walking steps is 4,341. His average liquid finger PPG is 108 mg/dL and liquid sensor PPG is 117 mg/dL (8% higher than finger and 9 mg/dL of PPG difference).
It should be noted that his personal target of post-meal walking is 4,000 steps. From his earlier research work, he has identified that each 1,000 post-meal walking steps would decrease PPG value by ~5mg/dL. Since his post-meal exercise amounts for these two food categories are almost equal, he can then mainly focus on the influence from food on his PPG values. In this particular study, food nutritional ingredients are almost identical, but his cooking methods are completely different which resulted into two totally different “physical phases”, i.e. liquid versus solid. His first exposure to physics and chemistry occurred in his first year of middle school, at age 10. He was taught to remember the three phases of matter: solid, liquid, and gas. After 62 years, this basic knowledge of physics came to mind which helped him discover these neurology related phenomenon.
Figure 2 shows the results of 65 solid food. It includes finger PPG (112 mg/dL), carbs/sugar (3.2 grams), post-meal walking (4,793 steps), sensor PPG (133 mg/dL), synthesized time-series curve, and candlestick chart.
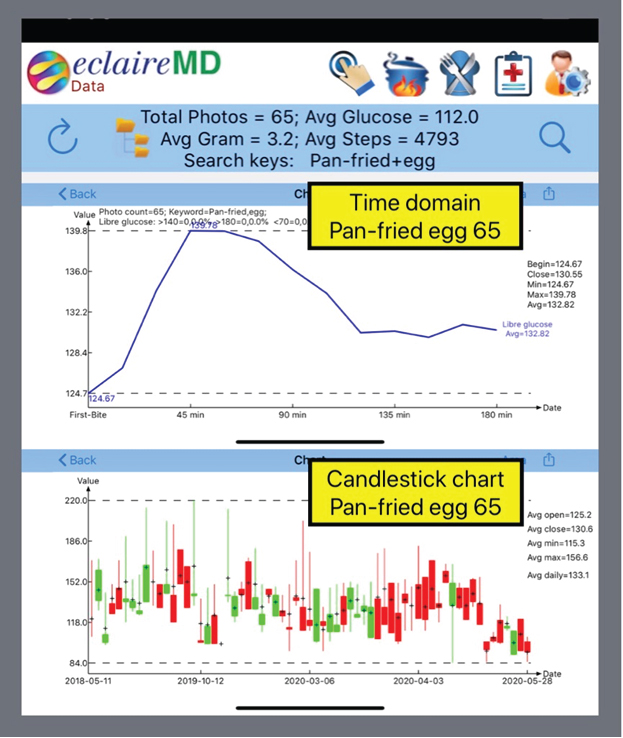
Figure 2. 65 Solid Meals (Pan-Fried Egg)
Figure 3 depicts the results of 70 liquid food. It includes finger PPG (108 mg/dL), carbs/sugar (2.1 grams), post-meal walking (4,341 steps), sensor PPG (117 mg/dL), synthesized time-series curve, and candlestick chart.
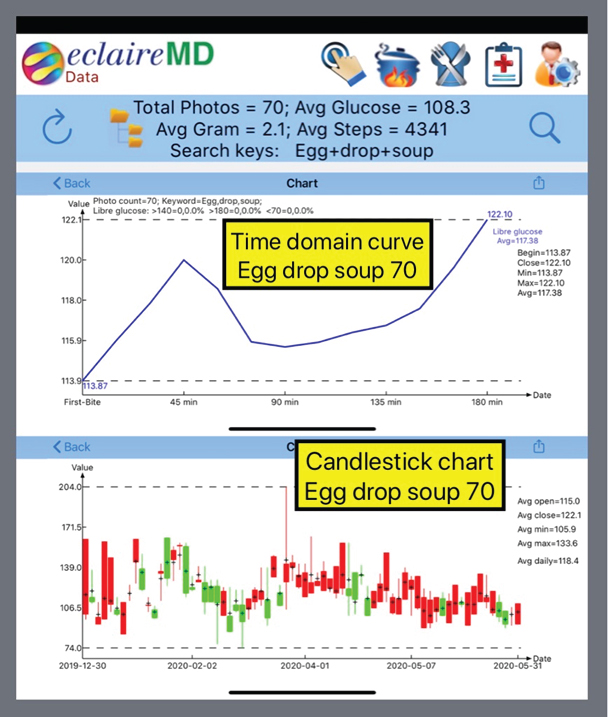
Figure 3. 70 Liquid Meals (Egg Drop Soup)
Figure 4 displays the detailed PPG data for each 15-minute time interval for both liquid food and solid food.
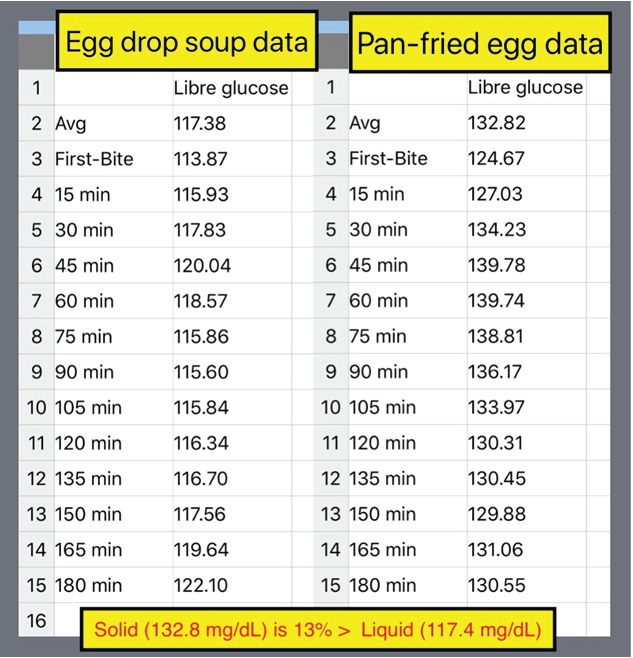
Figure 4. PPG Data Covering 180 Minutes Time Frame (Both Solid Food and Liquid Food)
The communication path is that the ascending messages from the stomach regarding the food arrival and its physical phase are transmitted to the brain, and the descending messages from the brain regarding the production amount and timing of glucose and insulin are transmitted to the liver and pancreas.
The total “relative” energy level for solid food is 76, while the total “relative” energy level for liquid food is 40. Therefore, solid food ends up having 90% excessive energy than liquid food. This 13% difference on average PPG values for solid and liquid food produces a 90% difference on their related energy levels. In the upper diagram of Figure 5, it shows that the time-domain curves have a larger gap between the solid food curve and liquid food curve. However, in the lower diagram of Figure 5, it shows that the frequency-domain areas have a 2 to 1 ratio (actually 1.9 to 1 ratio) between solid food and liquid food.
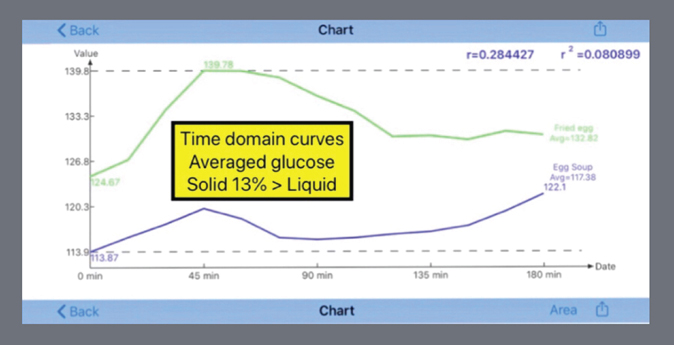
Figure 5. 2 PPG Waveforms
The significant PPG difference of 13% and their associated “relative” energy difference of 90% between these two food types can be easily observed from these research results.
The question here is why they look so different?
He wants to repeat his earlier statements in this conclusion section. Both the food’s physical appearances have the same nutritional ingredient inputs; however, their different cooking methods resulted into differing physical phases, liquid or solid. Maybe the initial message (or signal) ascending from the stomach to the cerebral cortex is not just food ingredients, but rather mainly the physical phase of food entry. Therefore, it is the author’s suspicion that the brain would misinterpret the soup as an equivalent to a cup of coffee or tea. The brain then issues a descending message to the liver for releasing a lesser amount of glucose. This lesser amount of glucose would carry a lower amount of relative energy level to create a lesser degree of impact or damage on human organs.
From a neuroscience point of view, the author has utilized his developed math-physical medicine methodology (MPM) and his learned biomedical knowledge to “trick” the cerebral cortex of the brain into producing or releasing a “lesser” amount of PPG to our body, without altering or reducing the needed food nutritional balance. If this idea works, by just changing the cooking method, it can then help many T2D patients to lower both their peak PPG and average PPG levels without reducing or changing their food nutritional contents. As a final result, T2D patient’s organs would suffer a lesser degree of impact or damage from the elevated glucose which carries excessive energy. Of course, they must avoid overeating food with high carbohydrates and sugar contents.
By sharing his research findings with other fellow medical research scientists through his medical articles and papers, he hopes that they can provide some better explanations, more proof, or further justifications by using a different or traditional research methodology, such as the biochemical medicine (BCM) approach.
- Hsu Gerald C, eclaireMD Foundation, USA, No. 229: Hypothesis on glucose production communication model between the brain and internal organs via investigating the PPG values of pan-fried solid egg meal vs. egg drop liquid soup meal.
- Hsu Gerald C, eclaireMD Foundation, USA, No. 76: Using Candlestick Charting Techniques to Investigate Glucose Behaviors (GH-Method: Math-Physical Medicine).
- Hsu Gerald C, eclaireMD Foundation, USA, No. 261: Comparison study of PPG characteristics from candlestick model using GH-Method: Math-Physical Medicine.
- Templeton, David, Pittsburgh Post-Gazette (2020) Pitt study shows brain and stomach connections are a two-way street. [Crossref]
- Hsu Gerald C, eclaireMD Foundation, USA, No. 266: Physical evidence of neural communication among brain, stomach, and liver via PPG waveform differences between liquid food and solid food.