The effects of Malaria coupled with the yearly climatic changes and variations of certain contributing factors embedded in the various ecological zones in Nigeria has continued to sustained the fluctuating indices of disease transmission and its endemicity. To understand these indices as a means of generating a further broad based control approaches, a cross-sectional study was conducted and results compared with retrospective data. Our findings indicate that of the 290 persons enrolled based on presumptive diagnosis, 108 (37%) were positive whereas 182 (63%) negative. Age distributions of those enrolled indicates 128(44.5 %%) were above 31 years, while the least was below 5years 6(2.10%). Coincidentally, diagnosis of malaria corroborates with the age distribution of 52(48.5%) for above 31years and 1(0.01%) for below 5years, although no significant differences recorded at P>0.05. Based on gender, more males 55(38%) than females 53(37%) were positive for malaria. Malaria parasitaemia indicates most malaria positive patients had 57(52.78%) below <1000 µL-, 33 (30.56%) between 1000-5000 µL-, and 18(6.67%) above >5000 µL-. Malaria incidence rate between years 2015-2018 indicates that of the 23,745 positive patients, more males 11,880 (50.03%) than females 11,865 (49.97%) were positive to malaria, although no significant differences at P>0.05. The year 2018 recorded the highest incidence of malaria an indication that despite several efforts aimed at control and elimination, the disease still continues to persist. We therefore suggest that a multi-dimensional strategy to the control and elimination of the parasites and vectors be put in motion to help curb the menace of this disease.
Malaria Parasites; Parasitaemia; Retrospective Analysis; Cross-Sectional Study; Jos-Nigeria
Malaria is a serious vector-borne disease affecting a greater proportion of Africans particularly Nigerians leading to cause of deaths, exacerbating economic hardships and dampening of national security in affected communities. The WHO [1-3] reports have all pointed to the devastating effects of this disease, culminating into large pools of clinical cases, morbidity and deaths. In Nigeria in particular, the infection and distribution of the mosquito vector has been shown to vary across different ecological zones based on certain factors favourable to their survival [4]. Thus, necessitating multi-disciplinary and multi-dimensional solutions. The disease is reported to affect all ages but in particular children under the ages of five (30% childhood) and pregnant women parasites (11% maternal mortality) who are greatly at the risk and complications of the cycles of the parasites despite the availability of effective interventions [5-7]. Whereas the distribution of the vectors is dependent on geography and climatic factors such as temperature, altitude and rainfall [6-7], the transmission indices also corroborate these factors [8-9], although the clinical and epidemiological features of malaria differ in different areas of transmission [10-12] and consequently determine approach to case management and control efforts.
To understand the continuous yearly variation in transmissions and give up-to-date information of malaria indices in certain parts of Nigeria, a cross-sectional study was conducted and results compared with retrospective data to ascertain if the continuous efforts at eradicating the parasites/vectors are yielding much desired fruits. In particular, Jos North Local Government Area of, Plateau State (North Central Nigeria) was choosing as pilot study and random sampling of patients attending the hospitals used for the study.
Study Area: Plateau State is located in Nigeria’s middle belt, and has an area of 26,899 square kilometers with an estimated population of about three million people. It is located between latitude 08º24´N and longitude 008º32´and 010º38´ east. The State is named after the picturesque Jos Plateau, a mountainous area in the north of the state with captivating rock formations. Jos North (the study area) is a Local Government Area in Plateau State, Nigeria, has its headquarters are in the city center of Jos, an area of 291km² and a population of 429,300 as at the 2006 census (Figure 1).
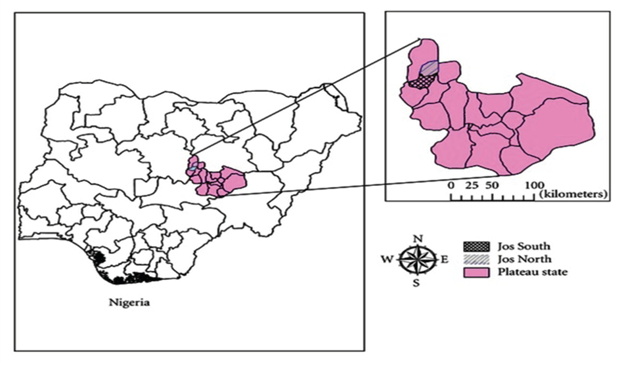
Figure 1. Map of Nigeria Showing Jos South and Jos North Areas of Plateau State
Source: https://www.researchgate.net/figure/Map-of-Nigeria-showing-Plateau-state-and-Jos-North-and-South-Local-Government-Areas_fig1_237200725
Ethical Clearance: To obtain a well range of data, two hospitals within the vicinity known/reported to have malaria patients who come from diverse communities within Nigeria were enlisted to obtain the needed information and to also address the questions of research itemized. These hospitals included: the University of Jos School clinic (Federal owned) and Plateau State Hospital (State owned) respectively. Ethical clearance was sought from above listed Hospital Ethics Committee
Social-demographic of the participant was collected using questionnaires and also past records of previous years of people infected with malaria parasites were obtained to ascertain the changes in incidence and prevalence.
Blood Sample Collection & Microscopic Test: In order to achieve to research objectives, collection of blood samples were carried out after obtaining the patients consent according to Epidi [13]. The gold standard microscopic tests which involve staining and direct visualization of the parasite under the microscope were used. Light microscopy of thick and thin stained blood smears were then made for the diagnosing of malaria [14]. Thick smears are 20-40 times more sensitive than thin smears for screening of Plasmodium parasites, with a detection limit of 10-50 trophozoites/µl [15]. These smears allow one to identify malaria species (including the diagnosis of mixed infection), quantify parasitaemia, and assess for the presence of schizonts, gametocytes, and malarial pigment in neutrophils and monocytes [16].
Staining & Quantification of parasitaemia: Giemsa stain was used for staining the smears and parasitaemia were counted according to the methods described by WHO [14, 16].
The minimum sample size was calculated using the formular [17].
n= Z²pq
d²
where: n= minimum sample size; p= prevalence of malaria (75%); q=complementary probability = (1- 0.75) = 0.25; d²= 5% confidence interval = 0.05; Z= value of 0.05 significant levels = 1.96
= 1.96² * 0.75 * 0.25 ;
0.05²
= 3.8416 * 0.75 * 0.25
0.0025
= 0.7203
0.0025
= 288.12 for all two hospitals
Age, Inclusion & Exclusion criteria: People of different age groups were sampled. Participants included those aged 5years and above. For minors, consent were obtained from their parents, while for adolescent child, accent were obtained in addition to parental consent to ascertain those who intend to enroll and participate in the study. A strict measure was taken to ensure that for the pregnant women, who consented to participate, they were not exposed beyond their routine medications and only women who consented to participate in the study were enrolled. Valid written informed consents were obtained from participants who decide to take part in the study. Adequate steps were taken to ensure that the participants were reasonably informed about the study and they are free to withdraw from the study at any time without adverse consequences. All patients data were maintained in an encrypted password protected V-computer and were accessed only by key personnel and the data entry clerk. Persons from the different age groups were selected. The results obtained from the research were only used for the purpose of this research. For the treatment of the patients, the patient’s results were made confidential, and were only made known to the participant. The slides after the conduct of the study were discarded properly and were not use for and other study. The Exclusion Criteria included any patient on anti-malarial treatment or any who had received anti-malarial therapy in the past two weeks preceding the study.
A total of 290 people from the two hospitals i.e. Plateau Specialist Hospital (PSSH) and the University of Jos Service Health Center (UJSHC) were examined for malaria parasite based on presumptive diagnosis. Of the 290 persons, 108 (37%) were confirmed positive based on microscopic examinations, whereas 182 (63%) were negative (Table 1). Statistical analysis using chi-square (χ2) indicates that there was no significant difference at 95% confidence interval (χ2cal =0.03; χ2tab =3.841; P=0.8695, P>0.05).
Concerned with results obtained above, a further inquiry into the distribution of the age grouping of the people examined from the two hospitals based on presumptive diagnosis showed that out of the 290 persons examined, 129 (44.5%) were from the age group of above 31, 59(19.3%) were between the ages of 21-25, 40 (13.8%) were between aged 16-20, 36 (12.4%) fell in the age group of 26-30, 11 (3.8%) where aged 6-10 while 9 (3.1%) are between the age of 11-15 and 6 (2.1%) were from age 0-5 years (Table 1). Statistical analysis using chi-square (χ2) indicates that there was no significant difference at 95% confidence interval (χ²cal 5.36; df= 6; χ²tab 12.592; χ²cal ˂ χ²tab; P=0.4982, P>0.05). Based on the malaria positive and negative patients among each age group, the highest malaria prevalence rate was seen among the age group above 31years with 52 (48.15%) persons testing positive to malaria parasite, while the least malaria infected age group was those between 0-5 (0.3%) years. Statistical analysis using chi-square (χ2) indicates that there was no significant difference at 95% confidence interval between the age groups (χ²cal 2.72; df= 6; χ²tab 12.592; χ²cal ˂ χ²tab; P=0.8342; P>0.05).
The prevalence rate of malaria parasite of 55 (19.0%) was recorded in the male, while the prevalence rate in female was 53(18.3%) as shown on Table 1. Although the number of males infected with malaria parasites was slightly more than the affected females, the prevalence statistical analysis showed no significant difference in gender (P= 0.8080; P>0.05). Male [χ²cal 2.39; df= 6; χ²tab 12.592; χ²cal ˂ χ²tab]; Female [χ²cal 6.03; df= 6; χ²tab 12.592; χ²cal ˂ χ²tab]. The total number of malaria parasite positive and malaria negative patients within the male age groups as shown on Table 1, indicates that the number of positive patients within the males were 55 and they have a prevalence rate of 19.0%. Statistical analysis of malaria prevalence according to male age groups showed no significant difference (P=0.6079; P>0.05). [ χ²cal 2.39; df= 6; χ²tab 12.592; χ²cal ˂ χ²tab ]. Table 1 show the total number of positive and negative patients within the female age groups. The positive patients within the females were 53 and having a prevalence rate of 18.3%. Statistical analysis of malaria prevalence according to female age groups showed a significant difference (P=0.4164; P<0.05). χ²cal 6.03; df= 6; χ²tab 12.592; χ²cal ˂ χ²tab
The total number examined in each age group against number of positive patients is also shown on Table 1. In age group 0-5, 6 (2.1%) persons were examined, 1 (0.3%) was infected with malaria parasite. For aged group 6-10, of the 11 (3.8%) examined, 3 (1.0%) were infected, the 11-15 group, 9 (3.1%) examined and 4 (1.4%) infected; age group 16-20, 40 (13.8%) examined, 15 (5.2%) infected. Further breakdown indicates that for age group 21-25, 59 (19.3%) were examined with 20 (6.9%) infected; while age group 26-30 indicates 36 (12.4%) examined, 13 (4.5%) infected and for age group of above 31, 129 (44.5%) examined and 52 (17.9%) infected. The statistical analysis of the prevalence of malaria parasite for the age group showed no significant difference (P= 0.8692; P>0.05).
Table 1: Number of Presumptive, Positive and Negative Malaria Patients Based on Age and Gender Grouping
Age Group |
Number of Presumptive Patients in each Age group |
Number of Presumptive, Positive and Negative Patients based on Sex grouping |
|
|
|
|
Presumptive/Positive Male |
Presumptive/Positive Female |
|
PD (%) |
Positive (%) |
Negative (%) |
PD (%) |
Positive (%) |
Negative (%) |
SP (%) |
Positive (%) |
Negative (%) |
0-5 |
6(2.1) |
1(0.3) |
5(1.7) |
3(1.0) |
0(0.0) |
3(1.0) |
3(1.0) |
1(0.4) |
2(0.7) |
6-10 |
11(3.8) |
3(1.0) |
8(2.8) |
8(0.9) |
3(1.0) |
5(1.7) |
3(1.0) |
0(0.0) |
3(1.0) |
11-15 |
9(3.1) |
4(1.4) |
5(1.7) |
4(1.4) |
3(1.0) |
1(0.3) |
5(1.7) |
1(0.4) |
4(1.4) |
16-20 |
40(13.8) |
15(5.2) |
25(8.6) |
23(7.9) |
9(3.10 |
14(4.8) |
17(4.9) |
6(2.1) |
11(3.8) |
21-25 |
59(19.3) |
20(6.9) |
40(13.8) |
24(8.3) |
10(3.5) |
14(4.8) |
36(12.4) |
10(3.5) |
26(9.0) |
26-30 |
36(12.4) |
13(4.5) |
23(7.9) |
18(6.2) |
7(2.4) |
11(3.8) |
18(6.2) |
6(2.1) |
12(4.1) |
>31 |
129(44.5) |
52(17.9) |
76(26.2) |
65(22.4) |
23(8.0) |
42(14.5) |
63(21.8) |
29(10.0) |
34(11.7) |
TOTAL |
290 (100) |
108(37.2) |
182(62.8) |
145(50.0) |
55(19.0) |
90(31.0) |
145(50.0) |
53(18.3) |
92(31.7) |
Key: PD-Presumptive diagnosis
Statistical Analysis: *Based on presumptive diagnosis= (χ2cal =0.03; χ2tab =3.841; P=0.8695, P>0.05).
*Age grouping based on presumptive diagnosis= (χ²cal 5.36; df= 6; χ²tab 12.592; χ²cal ˂ χ²tab ; P=0.4982, P>0.05).
*Based on +ve and -ve patients among each age group= (χ²cal 2.72; df= 6; χ²tab 12.592; χ²cal ˂ χ²tab; P=0.8342; P>0.05).
*Prevalence based on Sex; in Male [χ²cal 2.39; df= 6; χ²tab 12.592; χ²cal ˂ χ²tab]; Female [χ²cal 6.03; df= 6; χ²tab 12.592; χ²cal ˂ χ²tab] (P= 0.8080; P>0.05).
*Prevalence within male age groups (P=0.6079; P>0.05). χ²cal 2.39; df= 6; χ²tab 12.592; χ²cal ˂ χ²tab
*Prevalence within Female age groups (P=0.4164; P<0.05). χ²cal 6.03; df= 6; χ²tab 12.592; χ²cal ˂ χ²tab
The level of parasitaemia cut across <1000 µL-1, 1000-5000 µL-1 and >5000 µL-1 (Table 2). A breakdown indicates both Sexes had 57 (52.8%) under the parasite density <1000 µL-1, 33 (30.6%) under the parasite density 1000-5000 µL-1 and 18 (6.7%) under the parasite density >5000 µL-1. Statistical analysis indicates there was a significant difference among sexes across the different parasite density. (P=0.5944; P<0.05). Conversely, parasite density across age groups showed that 57 (52.8%) had parasitaemia <1000 µL-1, 33 (30.6%) had parasitaemia between 1000-5000 µL-1 and 18 (16.7%) had parasitaemia >5000 µL-1. Statistical analysis indicates there was no significant difference in age grouping (P=0.3983; P>0.05). The parasite density between the male age group showed that 27 (25.0%) had parasite density of <1000 µL-1, 17 (15.8%) had parasite density between 1000-5000 µL-1 and 11 (10.2%) had parasite density of >5000 µL-1. The males that are 31above had the highest level of parasite density 23 (21.3%). There was no significant difference among age group. (χ²cal 10.31; df= 6; χ²tab 12.592; χ²cal ˂ χ ²tab) (Table 2). The parasite density between the female age group showed that 30 (27.8%) had parasite density of <1000 µL-1, 16 (14.8%) had parasite density between 1000-5000 µL-1 and 7 (6.5%) had parasite density of >5000 µL-1. The females that are above 31 years had the highest level of parasite density 29 (26.9%). Statistical analysis indicates there was a significant difference among age group. (χ²cal 16.47; df= 6; χ²tab 12.592; χ²cal ˃χ²tab).
Table 2: Malaria Parasite Density (Parasitaemia) with Respect to Sex and Age Grouping
Parameters |
Levels in Parasitaemia of various sexes and age group |
Sex |
˂1000 µL-1 |
1000-5000 µL-1 |
˃5000 µL-1 |
Total |
|
PP (%) |
PP (%) |
PP (%) |
PP (%) |
Male |
27(25.0) |
17(15.7) |
11(10.2) |
55(50.9) |
Female |
30(27.8) |
16(14.8) |
7(6.5) |
53(49.1) |
TOTAL |
57(52.8) |
33(30.6) |
18(16.7) |
108(100) |
Age/Sex |
˂1000 µL-1 |
1000-5000 µL-1 |
˃5000 µL-1 |
Total |
Group |
PP (%) |
Male (%) |
Female (%) |
PP (%) |
Male (%) |
Female (%) |
PP (%) |
Male (%) |
Female (%) |
PP (%) |
Male (%) |
Female (%) |
0-5 |
1(0.9) |
0(0.0) |
1(0.9) |
0(0.0) |
0(0.0) |
0(0.0) |
0(0.0) |
0(0.0) |
0(0.0) |
1(0.9) |
0(0.0) |
1(0.9) |
6-10 |
2(1.9) |
2(1.9) |
0(0.0) |
1(0.9) |
0(0.0) |
1(0.9) |
0(0.0) |
0(0.0) |
0(0.0) |
3(2.8) |
2(1.9) |
1(0.9) |
11-15 |
2(1.9) |
2(1.9) |
0(0.0) |
1(0.9) |
1(0.9) |
0(0.0) |
1(0.9) |
0(0.0) |
1(0.9) |
4(3.7) |
3(2.8) |
1(0.9) |
16-20 |
7(6.5) |
5(4.6) |
2(1.9) |
5(4.6) |
3(2.8) |
2(1.9) |
3(2.8) |
2(1.9) |
1(0.9) |
15(13.9) |
10(9.3) |
5(4.6) |
21-25 |
10(9.3) |
7(6.5) |
3(2.8) |
4(3.7) |
2(1.9) |
2(1.9) |
6(5.6) |
2(1.9) |
4(3.7) |
20(18.5) |
11(10.2) |
9(8.3) |
26-30 |
11(10.2) |
4(3.7) |
7(6.5) |
1(0.9) |
1(0.9) |
0(0.0) |
1(0.9) |
1(0.9) |
0(0.0) |
13(12.0) |
6(9.4) |
7(6.5) |
>31 |
24(22.2) |
7(6.5) |
17(15.8) |
21(19.5) |
10(9.3) |
11(10.2) |
7(6.5) |
6(5.6) |
1(0.9) |
52 (48.2) |
23(21.3) |
29(26.9) |
TOTAL |
57(52.8) |
27(25.0) |
30(27.8) |
33(30.6) |
17(15.8) |
16(14.8) |
18(16.7) |
11(10.2) |
7(6.5) |
108(100) |
55(50.9) |
53(49.1) |
Key: PP= Positive Patients
Statistical Analysis: *Parasite density (parasitaemia) among Sexes= (P=0.5944; P<0.05).
*Parasite density (parasitaemia) across age groups= (P=0.3983; P>0.05).
*Parasite density (parasitaemia) between the male age group= (χ²cal 10.31; df= 6; χ²tab 12.592; χ²cal ˂ χ ²tab ).
*Parasite density (parasitaemia) between the Female age group (χ²cal 16.47; df= 6; χ²tab 12.592; χ²cal ˃χ²tab ).
Table 3 shows malaria incidence rate between years 2015-2018. It also show incidence rate based on Sex and various hospital facilities. More number of males were recorded to have been infected (11,880) with malaria parasites over these periods as compared to their female counterparts (11,865), with an incidence difference of 0.1% calculated. The Plateau Specialist Hospital despite its recording of the highest number of malaria patients over these periods, a breakdown indicates that it also recorded the highest in both Sexes with an incidence difference of 29.70% among male and 24.30% among females. Statistical analysis indicates there was a significant difference in both hospital (P=0.0355; P<0.05).
A breakdown of the total number of male and female patients for malaria incidence in 2015 down to 2018 indicates that of the 23,745 patients, 11,880 (50.03%) were males, while 11,865(49.97%) were females with a percentage difference of 0.1%. The male recorded the highest amount from both hospitals. 2.5% indicates the percentage difference of male from both hospitals and 3.0% difference among females from both hospitals. Statistical analysis indicates a significant difference was obtained between both gender (P= 0.0355; P<0.05). (Table 3).
Malaria incidence of patients across various years is also shown on Table 3. 2018 showed the highest rate of malaria incidence of 6636. From 2015 – 2016, the percentage difference was 9.1%, 2016-2017 percentage difference of 2.4% and from 2017-2018 a percentage difference of 10.6%. 2015 recorded the lowest malaria incidence. The malaria incidence rate of both Sexes across each age group at University of Jos Health Services Center is shown on Table 3. The highest difference was among those aged above 31. Table 3 also showed the malaria incidence at Plateau Hospital with age group 6-10 recording the percentage difference of 41.2%.
The malaria incidence in the University Clinic shown on Table 3, for 2016 recorded an equal number of males and females in age group of 16-20. 40.0% incidence differences were from age group of 0-5 years. Likewise on Table 3, at Plateau Specialist hospital, age 6-10 recorded 70.5% incidence difference between male and female in 2016. Table 3 also showed that in 2017 at the Plateau Specialist Hospital, the age group 6-10 recorded 57.6% incidence difference among sexes, while age group of 0-5 recorded the highest incidence difference of 67.9%. In 2018, a breakdown between the sexes indicates, the highest incidence difference of 35.5% was from the age group above 31 years at the University clinic, while the age group 21-25 had 40.6% incidence difference at the Plateau Specialist Hospital.
Table 3: Malaria Incidence among Various Ages and Sexes from Various Health Centres in Jos
Area |
Malaria incidence in various years |
|
|
|
|
|
|
|
2015 |
2016 |
% Diff |
2016 |
2017 |
% Diff |
2017 |
2018 |
% Diff |
|
|
|
|
PSH |
3216 |
3543 |
9.6 |
3543 |
2944 |
18.5 |
2944 |
3772 |
24.6 |
|
|
|
|
UJHSC |
2101 |
2283 |
8.3 |
2283 |
3022 |
27.7 |
3022 |
2864 |
5.4 |
|
|
|
|
Total |
5317 |
5826 |
9.1% |
5826 |
5966 |
2.4% |
5966 |
6636 |
10.6% |
|
|
|
|
Malaria Incidence based on Sex |
|
|
|
|
|
Male |
Female |
%Diff |
|
|
|
|
|
|
|
|
|
|
|
11880 |
11865 |
0.1% |
|
|
|
|
|
|
|
|
|
|
Malaria Incidence among Sexes within various Health Centres |
|
|
|
|
|
Male |
Female |
%Diff |
|
|
|
|
|
|
|
|
|
|
PSH |
6822 |
6653 |
2.5 |
|
|
|
|
|
|
|
|
|
|
UJHSC |
5058 |
5212 |
3.0 |
|
|
|
|
|
|
|
|
|
|
Total |
11880 |
11865 |
|
|
|
|
|
|
|
|
|
|
|
Malaria Incidence among Sexes between various Health Centres |
|
|
|
|
Sex/Area |
PSH |
UJSHC |
%Diff |
|
|
|
|
|
|
|
|
|
|
Male |
6822 |
5058 |
29.7 |
|
|
|
|
|
|
|
|
|
|
Female |
6653 |
5212 |
24.3 |
|
|
|
|
|
|
|
|
|
|
Area |
Malaria Incidences |
|
|
PSH |
|
2015 |
2016 |
2017 |
2018 |
|
Age group |
Male |
Female |
% Diff |
Male |
Female |
% Diff |
Male |
Female |
% Diff |
Male |
Female |
% Diff |
|
0-5 |
80 |
63 |
23.7 |
83 |
70 |
17.0 |
69 |
34 |
67.9 |
60 |
53 |
12.4 |
|
6-10 |
120 |
79 |
41.2 |
163 |
78 |
70.5 |
123 |
68 |
57.6 |
161 |
128 |
22.8 |
|
11-15 |
250 |
201 |
21.8 |
227 |
182 |
22.0 |
139 |
144 |
3.5 |
199 |
234 |
16.2 |
|
16-20 |
184 |
248 |
29.6 |
291 |
278 |
4.6 |
171 |
150 |
13.1 |
280 |
271 |
3.3 |
|
21-25 |
230 |
327 |
34.8 |
320 |
343 |
6.9 |
250 |
332 |
28.2 |
379 |
251 |
40.6 |
|
26-30 |
374 |
258 |
36.70 |
289 |
364 |
22.9 |
296 |
267 |
10.3 |
367 |
422 |
13.9 |
|
>31 |
380 |
422 |
10.50 |
411 |
444 |
7.7 |
483 |
418 |
14.4 |
443 |
524 |
16.7 |
|
Total |
1618 |
1598 |
1.2% |
1784 |
1759 |
1.4% |
1531 |
1413 |
8.0% |
1889 |
1883 |
0.3% |
UJHSC |
|
2015 |
2016 |
2017 |
2018 |
|
Age group |
Male |
Female |
% Diff |
Male |
Female |
% Diff |
Male |
Female |
% Diff |
Male |
Female |
% Diff |
|
0-5 |
16 |
12 |
28.6 |
30 |
20 |
40.0 |
22 |
18 |
20.0 |
16 |
21 |
27.0 |
|
6-10 |
28 |
34 |
19.4 |
40 |
39 |
2.5 |
41 |
32 |
24.6 |
32 |
31 |
3.2 |
|
11-15 |
130 |
66 |
65.3 |
121 |
93 |
26.2 |
114 |
94 |
19.2 |
70 |
74 |
5.6 |
|
16-20 |
261 |
288 |
9.8 |
337 |
337 |
0.0 |
419 |
424 |
1.2 |
389 |
332 |
15.8 |
|
21-25 |
215 |
275 |
24.5 |
221 |
307 |
32.6 |
341 |
306 |
10.8 |
321 |
359 |
11.2 |
|
26-30 |
200 |
191 |
4.6 |
269 |
214 |
22.8 |
301 |
332 |
9.8 |
363 |
338 |
7.1 |
|
>31 |
163 |
222 |
30.6 |
115 |
140 |
19.6 |
270 |
308 |
13.1 |
213 |
305 |
35.5 |
|
Total |
1013 |
1088 |
7.1% |
1133 |
1150 |
1.5% |
1508 |
1514 |
0.4% |
1404 |
1460 |
3.9% |
Key: Diff= Difference
Prevalence of Malaria Parasite: The prevalence of malaria parasite in the blood film of some of the patients was quiet high. This was a reflection of the high rate of malaria parasitaemia in endemic malaria regions. The sum total of the prevalence of malaria parasite of 37.24% in the study area was lower than 80.25% reported by Ukpai and Ajoku [18] in Okigwe and Owerri, South-eastern Nigeria; 76% by Aribodor[19] in Azia, Anambra State; 85.1% by Okonko et al. [20] in Abeokuta; 53.5% obtained in Ogun State by Sam-Wobo et. al. [21] and 80.4% by Kalu et. al. [22] in some parts of Abia State in South-eastern Nigeria. The prevalence of malaria parasite was also higher in other similar studies reported from other parts of Nigeria as in Anambra State, Nigeria reported by Onyido et. al. [23]. Although the prevalence was higher than those reported by Igbeneghu et. al. [24] who reported 21.1% in Iwo community in Oyo State and Abdullahi et. al. [25] who reported a prevalence rate of 27.29%. This wide range difference in malaria prevalence may be attributed to the climatic factors and behavioral pattern of persons in the area which helps or contribute to breeding site of the mosquitoes and susceptibility of the people in the area to vector bites. Plateau State has a temperate climate with an average temperature of 13ºC and 22ºC. The average lower temperatures in Plateau State could have contributed to the reduced incidence of some tropical diseases such as malaria.
Prevalence rate of 37% in the study represents almost an average substantial level of illness, especially when one considers that the severity of the disease is likely high given the low level of immunity among the population [26]. Malaria is still a heavy burden on the continent, despite all that have been said and done. The prevalence of malaria parasite is attributed to its ability to resist attack by some of the methods used for the fight against it. These could range from the Stagnant drainage systems in the environment which creates a very favorable environmental conditions for the breeding of this diseases carrying insects and this enhances the reproduction of the Plasmodium species to non-compliance to taking of taking recommended complete drug dosage by patients.
Prevalence between Gender and Age Group: Although Malaria prevalence among the gender was not statistically significant (P>0.05), malaria parasitaemia was slightly higher among the males than the females. This agrees with the result obtained by Mendel and White [27], Pelletier et. al. [28], Malcom [29] and Ukpai and Ajoku [18], although quite lower in males than females as reported by Goselle et. al. [30] in HIV/AIDS positive patients. The reduced prevalence in females in this study could be attributed to findings which show that females have better immunity to malaria and varieties of other parasitic diseases due to hormonal and genetic factors [31]. Portilo and Sullivan [31] suggested that these genetic factors could play a role by endowing females with immune-regulatory potentials to cope better with some disease infections. This may equally be attributed to the fact that males expose themselves to the bites of mosquitoes and other vectors more than females, especially when the weather is hot. Exception is found during pregnancy and reproductive ages, when females are more vulnerable to malaria attacks due to immune suppression [19].
Malaria prevalence was not statistically significant in the various age group (P>0.05). Most of the children were not exposed to the study due to the refusal of Parents. Prevalence of malaria in the older was high and this agrees with Uneke et. al. [32], who recorded higher prevalence among older age groups in a similar study in Jos, Nigeria. During hot weathers, adults are mostly seen sleeping outdoors, sometimes for the whole night exposing them to risk of getting infected.
Malaria Parasitaemia between Gender and Age Group: The parasitaemia level was not statistically significant among gender (P>0.05) and not statistically significant among age group (P>0.05). Although the below >1000 µL– recorded the highest an indication of probably asymptomatic malaria. This also agrees with the reports by Goselle et. al. [30]. The results obtained from the study clearly indicates that there are high chances that individuals on presumptive diagnosis of people could be higher when compared with conventional malaria diagnostic methods, implying that there could be high chances of treating those who are actually not sick of malaria, a false-positive phenomenon. This agrees with the reports of WHO[5, 33], that presumptive treatments based on axillary temperature continue to remain a great challenge and therefore recommend that confirmation of parasites in body fluids for all suspected cases and treatments should only be applied to clinical feeling when parasitological diagnosis that requires a sensitivity of more than 90% are not available
Incidence of Malaria: The findings indicate that of the years of the data collected, 2018 had the highest rate of incidence as compared to previous years. This is at variant with the report by Lee et. al. [34] on Plasmodium vivax infection in South Korea between 2013-2014. An indication that conscious and proactive malaria data surveillance needs be enhanced in Nigeria.
Although several efforts have been made to effectively control the high incidence of malaria in Nigeria, as long as there are stagnant gutters, swamps, bushes environment in our environment where the mosquitoes breed in millions, there shall be no respite to the malaria scourge and its attendant effect on health and socio-economic life of Nigerians and by extension Africans35. According to Atif et. al. [36], reducing poverty and improving sanitation and access to health care in malaria endemic regions would go a long way to reduce the malaria burden. Vector control (reducing the breeding grounds by spraying or destruction of habitat) has only had very limited success. WHO suggested the use of insecticide-treated bed nets (ITNs), indoor residual spraying, and targeted chemoprophylaxis for those most at risk for pregnant women and travelers.
Recommendation: In light of the current progress of malaria control efforts in Nigeria, a key aspect of future research should therefore focus on understanding treatment-seeking behavior, barriers to accessing health services among febrile persons and quantifying patterns of malaria transmission. Furthermore, interventions and preventive measures should be put to place and these should include; reducing of poverty, improving and access to health care centers.
We profoundly wish to acknowledge the management and staff of the two hospitals i.e. Plateau State Specialist Hospital and the University of Jos for providing the enabling environment for us to carry out this robust research work and also availing us the opportunity to comb through the records of malaria infection previous years to engage in our retrospective analysis.
Declaration of conflict of interest
The authors wish to declare that there are no conflicts of interest arising from the writing of this manuscript
The project is a self- sponsored project carried out in the Department of Zoology, University of Jos in collaboration with the two health centers
Goselle Obed Nanjul ……….
- World Health Organization (2005) World malaria report.
- World Health Organization (2006) The African malaria report.
- World Health Organization (2018) ‘Malaria fact sheet’ 2018. Retrieved 17th march.
- Bhatt S, Weiss DJ, Cameron E, et al. (2015) The effect of malaria control on Plasmodium falciparum in Afric between 2000 and 2015. Nature 526: 207-211. [Crossref]
- WHO/UNICEF (2003) The Africa Malaria Report. WHO/CDS/MAL/2003; 1093.
- World Health Organization (2015) Guidelines for treatment of malaria, Geneva: 3rd edition. WHR 2015 for 2016.
- WHO malaria control: the power for integrated action (2017) The health and environment linkages initiative.
- Craig MH, Snow RW, Le Sueur D (1999) Climate-based distribution model of malaria transmission in sub-Saharan Africa. Parasitol Today 15: 105-111. [Crossref]
- Okwa OO. Akinmolayan FI, Carter V (2009) Dynamics of malaria in Four Selected Ecological Zones of Nigeria in Rainy Season. An Afri Med 8: 1-9. [Crossref]
- Muhe L, Oljira B, Degefu H, et al. (1999) Clinical algorithm for malaria during low and high transmission seasons. Archives Dis in Childhood 81: 216-220. [Crossref]
- Bruce MC, Macheso A, Kelly Hope LA, et al. (2008) Effect of transmission setting and mixed species infections on clinical measures of malaria in Malawi. PloS One 23;3(7): [Crossref]
- Autino B, Noris A, Russo R, et al. (2012) Epidemiology of malaria in endemic areas. Med J Hematol Infec Dis 4: e2012060. [Crossref]
- Epidi TT, Nwani CD, Ugorji NP (2008) Prevalence of Malaria in blood donors in Abakaliki Metropolis, Nigeria. Sc Res and Essay 3: 162-164.
- World Health Organization (2000) Manual for Indoor Residual Spraying Application of Residual Sprays for Vector Control.
- Microbe Online (2010) Thick and Thin Blood Smear for Malaria Diagnosis.
- World Health Organization (1991) Basic Malaria Microscopy (Part I and II).
- Katz D, Elmore J, Wild D, et al. (2013) Jekel's Epidemiology, Biostatistics, Preventive Medicine, and Public Health 4th Edition. Imprint Saunders 420.
- Ukpai OM, Ajoku EJ (2001) The prevalence of malaria in Okigwe and Owerri area of Imo State, Nigeria. J Parasitol 22: 83-84.
- Aribodor DN, Njoku OO, Eneanya CI. Et. al. (2003). Studies on the prevalence of malaria and management practices of the Azia Community in Ihiala Local Government Area, Anambra State. Nig J Parasitol 24:33-38.
- Okonko IO, Soleye FA, Amusan TA, et al. (2009) Prevalence of malaria Plasmodium in Abeokuta, Nigeria. Malaysian J Microbiol 5:113-118.
- Sam Wobo SO, Amusa AA, Idowu OA, et al. (2010) Assessment of HIV and malaria infections and perception among anti-antennal women in Ogun State, Nigeria. J National Sci and Engr Tech 9: 115-123.
- Kalu KM, Obasi NA, Nduka FO, et al. (2012) A comparative study of the prevalence of malaria in Aba and Umuahia urban areas in Abia State. Nig Research J Parasitol 7: 17-24.
- Onyido AE, Obinatu SC, Umeanato PU, et al. (2011) Malaria prevalence and mosquito vector abundance in Uli town. Ihiala local government area. Anambra State, Nigeria. Afri J Biomed Res 14: 175-182.
- Igbeneghu C, Odaibo AB, Olaleye DO (2011) Impact of asymptomatic malaria on some hematological parameters in the Iwo community in Southwestern Nigeria. Med Principle and Practice J 20: 459-463. [Crossref]
- Abdullahi K, Abubakar U, Adamu T, et al. (2009) Malaria in Sokoto, Northwestern Nigeria. Afri J Biotech 8: 7101-7105.
- Klinkenberg E, Mc Call PJ, Hastings IM, et al. (2005). Malaria and irrigated crops, Accra, Ghana. Emerging Infect Dis 11: 1290-1293. [Crossref]
- Mendel BK, White MRJ (1994) Lecture notes on the infectious diseases (4th edition). Blackwell Scientific Publications, UK 1994; 172-193.
- Pelletier DL, Frongillo EA, Schoeder DG, et al. (1995) The effect of malnutrition on child mortality in developing countries. Bull WHO 73:28-29. [Crossref]
- Malcom M (2001) Malaria in non-endemic areas. Am J Med and Trop Infec 25:28-29. [Crossref]
- 30. Goselle ON, Onwuliri COE, Onwuliri VA (2007) Malaria and the Effect of Malaria parasitaemia on albumin level among HIV/AIDS-Patients in Jos, Nigeria. J Med Sc 7: 1187-1191.
- Portillo WR, Sullivan CC (1979) Genetic factors that influence immune regulatory potentials in females against some diseases. J of Biotech 2: 111-115.
- 32 Uneke CJ, Ogbu O, Inyama PU, et al. (2005) Malaria infection in HIV-seropositive and HIV-seronegative individuals in Jos. Nigeria. J Vector Borne Dis 4: 151-154. [Crossref]
- World Health Organization (2010) Global report on antimalarial drug efficacy and drug resistance: 2000–2010, Tech Rep.
- Lee HW, Park SH, Na BK, et al. (2017) Changing Vivax Malaria Transmission Features in the Republic of Korea during 2013-2014. J Trop Dis 5: 1-9.
- Yusuf M (2007) Africa Malaria Day Should Focus on Africa of mosquitoes. Pharma News 29:1-64.
- Atif SH, Farzana M, Naila S (2009) Incidence and pattern of malarial infection at a tertiary care hospital of Hyderabad. World J Med Sc 4: 9-12