Background: Understanding the determinants of choice of contraceptives is very critical especially in population where heterogeneous socio-cultural factors play an important role. A contraceptive choice that couples make is a key component of the Sustainable Development Goal agenda and a major contributor to national health. The issues which impact women’s reproductive health rights in relation to contraception relate to socio-demographic variables like age, education, family size, religion, occupation etc. This study thus explores the influence of such socio-demographic data on the choice of contraceptives among women in Akpulu, Ideato North Local Government Area, Imo State, Nigeria.
Methods: A cross sectional study was used in this quantitative research to generate data on contraceptive choices of women in Akpulu. A structured questionnaire was used to elicit information from 481 respondents who were randomly sampled at their different villages and kindreds. Descriptive and non-parametric statistics of chi-square test were used in the data analyses and results were presented using tables.
Results: The findings of the study revealed that 21.4% of the respondents use fertility awareness method as their choice of contraceptives. Very few (26.4%) of the respondents opined that they always use contraceptives. Findings also established that age, level of education, number of children, religious affiliation and occupation of the respondents play a significant role in the choice of contraceptives among the women in Akpulu, Ideato North Local Government Area, Imo State, Nigeria.
Conclusion: The result of the study indicated that the socio–demographic data of the respondents has a significant role in the choice of contraceptives among the women in Akpulu, Ideato North Local Government Area, Imo State, Nigeria.
Recommendation: The study recommends comprehensive education of the women on the benefits of each method of contraception for adoption of better choice of contraceptives among these women. There is also need to clarify religious misconception about family planning methods by seeking the active collaboration and support of religious leaders.
Socio-Demographic Variables; Contraceptives; Choice; Women
The utilization of contraceptives is one of the major determining factors for reducing fertility. This has increased steadily over the years and currently widespread throughout the world. However, progress has not been the same in terms of geographical areas, and problems still remain in terms of both increasing the level of use [1] to meeting current demand in certain regions and making available various types of methods to individuals wishing and willing to use contraception [2].
Contraceptive utilization has multiple benefits to women who are using it and community in advance. Contraceptives prevent unintended pregnancies, reduce the number of abortions, and lower the incidence of death and disability related to complications of pregnancy and childbirth. The long-term benefits range from increased education for women and better child health to greater family savings and stronger national economies. Increased contraceptive use and reduced unmet need for contraception are central to improving maternal health, reducing child mortality and combating HIV/AIDS [3, 4, 5]. Vincent highlighted five types/methods of contraceptives, which are barrier methods e.g. condoms, hormonal contraceptives e.g. pills and injectable, long acting reversible contraception (LARC) e.g. intrauterine device, implant etc. fertility awareness (FA) e.g. billings, ovulation method, symptom-thermal method, calendar etc [6].
An estimated 225 million women in developing countries would like to delay or stop childbearing but are not using any method of contraception3. The worldwide rate of unintended pregnancy in 2012 was 53 per 1,000 women aged 15-44 with the highest regional rate in Africa [5]. Avoiding barriers to the use of contraceptive methods could avert 54 million unintended pregnancies, 79,000 maternal deaths and one million infant deaths each year [7]. According to the World Health Organization (WHO), Nigeria had the second highest number of annual maternal deaths in the world in 2010 and contributed 14% of all maternal deaths globally [3]. As at 2015, Nigeria has a maternal mortality ratio of about 814 per 100,000 live births [4]. Within Nigeria, Maternal Mortality Rate (MMR) figures differs between geo-political zones, with southwestern Nigeria having one of the lowest rates of preventable Maternal and Perinatal deaths [8].
Family planning (FP) is the capability of spouses, husband, partners or individuals to choose the number of children they desire, or they want and the time to have them [9]. This can be attained by the use of Family planning (FP) methods which is one of the most cost effective public health interventions center in decreasing a country’s fertility rate. Family planning has also been found to assist gender equality as well as educational and economic empowerment for women [10]. Vincent opined that choice of contraceptive method depends on the individual’s perception, its cost, and effectiveness and associated risks. Unfortunately, only total abstinence which is hardly practicable for married couples is cheap, has 100% effectiveness and without risk [6]. She maintained that women use contraceptives for different reasons varying from delaying pregnancy to avoiding future pregnancy, and that age, marital status, desired family size, frequency of sexual intercourse, etc. all can influence women’s choice and use of contraceptive methods. Ultimately, the client must choose a contraceptive method that will be acceptable to her particular life situation [6].
In Nigeria, it is projected that a reduction in fertility by one child per woman would lead to 13% increase in gross domestic product per capita within 20 years [11]. Nigeria is yet to get a very good dividend of FP as the choice and usage of contraception remains very low. Decreasing fertility rate of women to one child per woman will possibly cause an increase in the GDP to 13% in 20 years’ time if properly implemented [12].
In Nigeria, women who have a higher educational level are more likely to decide on the contraception to use than women with secondary or lower education [11]. On the contrary, couples contraception choice is known to be higher if at least one partner has had a primary or higher education than if both had no education [12]. However, women that pose higher education than their husbands tend to use and choose contraceptives they desire more than women who have less education compared to their husbands [11]. Whilst only 15 % of married couples were choosing and using the type of contraceptive they preferred, 10% did not use any type of modern contraception [13]. The issue of couples deciding whether or not to have children is primarily influenced by external forces such as marital status, the cultural and socio-economic status of women [14].
Understanding the determinants of choice of contraceptives is very critical especially in population where heterogeneous socio-cultural factors play an important role. In the population under study, some of them come to the family planning clinic with their minds set on particular contraceptive methods. Speculations are that choice may be dependent on some variables such as influence of significant others individual perception, awareness, level of education, family size, age, religion, convenience of the method and so on. Hence, it is important to understand the socio demographic factors that have effect on the choice of contraceptives among women in Akpulu, Ideato North Local Government Area, and Imo State, Nigeria.
They study adopted a cross sectional descriptive survey design to find information from participants on the use and the influence of socio-demographic data on contraceptive choices among women Akpulu, Ideato North Local Government Area, Imo State, Nigeria. The relationship/association between the study variables and use and choice of contraceptives was explored. Stratified and convenient sampling technique was employed to recruit study participants while putting into consideration women willingness to participate.
The sample population of 481 was drawn through the use of Taro Yamane sampling size determination, which is 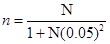
where n is the sample size, N is the target population, 1 is constant, 0.05 is the level of significance. A questionnaire was self-developed to elicit information from participants on contraceptive usage and choices. The self-developed questionnaire was pre-tested which yielded a reliability index of 0.91. The copies (481) of the questionnaire were administered on face to face basis by the researcher and four research assistants (one from each village) and were adequately filled and retrieved thereafter. Since the data collected was basically quantitative, it was analyzed descriptively which included frequencies and percentages. Chi- square test was used to analyze the effect of the socio-demographic variables on contraceptive choice. The results were presented using tables.
All the respondents had formal education but more than half (57.6%) had secondary education. Surprisingly, 15.4% of the respondents had up to seven children. The respondents are predominately (59.9%) Catholic (RCM). A good number of the respondents (77.3%) enjoy monogamous marriage.
Table 1. Socio-Demographic Variables of the Respondents (N = 481)
Variable |
Category |
Frequency (f) |
Percentage (%) |
|
Age |
Below 25 years
25-29 years
30-34 years
35-39 years
40 years and above |
46 107 169 137 22 |
9.6 22.2 35.1 28.5 4.6 |
|
Level of Education |
No Formal Education
Primary Education
Secondary Education
Tertiary Education |
0 22 227 182 |
0.0 4.6 57.6 37.8 |
|
Number of Children |
1-2
3-4
5-6
7 and above |
99 118 190 74 |
20.6 24.5 39.5 15.4 |
|
Religious Affiliation |
Roman Catholic Mission (RCM)
Anglican/Methodist/Assemblies of God
Pentecostals (Unorthodox)
Others (Amok, Eckankar, African Traditional Religion, Grail Message etc.) |
288 139 43 11 |
59.9 28.9 8.9 2.3 |
|
Occupation |
Civil Service
Trading/Farming
Self-employed/Private Service
Unemployed/Housewife/Student |
102 203 122 54 |
21.2 42.2 25.4 11.2 |
|
Type of Marriage |
Monogamy
Polygamy |
372 109 |
77.3 22.7 |
Table 2. Choice of Contraceptives among the Respondents (N = 481)
Contraceptives |
Frequency (f) |
Percentage (%) |
|
Barrier methods e.g. Condom, Sponge, Spermicide, Diaphragm |
212 |
44.1 |
|
Hormonal contraceptives e.g. Pills and Injectables |
68 |
14.1 |
|
Long Acting Reversible Contraception (LARC) e.g. Intrauterine Devices, Implant |
98 |
20.4 |
|
Fertility Awareness (FA)/Natural Family Planning (NFP) e.g. Billings, Sympto-thermal, Ovulation, Calendar method etc. |
103 |
21.4 |
|
Permanent contraception e.g. Tubal ligation, Vasectomy |
0 |
0.0 |
Total |
481 |
100 |
More respondents (44.1%) use barrier method as their choice of contraceptives whereas 21.4%, 20.4% and 14.1% use fertility awareness (F/A), LARC and hormonal methods respectively. None of the respondents use tubal ligation as their choice of contraceptive.
Table 3. Extent of Use of Contraceptive Methods among the Respondents (N = 481)
Extent of use |
Barrier (%) |
Hormonal (%) |
LARC (%) |
F/A (%) |
Total (%) |
Always |
38 (19.9) |
19 (27.9) |
50 (51.0) |
20 (19.4) |
127 (26.4) |
|
Sometimes |
68 (32.1) |
21 (30.9) |
40 (40.8) |
42 (40.8) |
171 (35.6) |
|
Rarely |
106 (50.0) |
28 (41.2) |
8 (8.2) |
40 (39.8) |
183 (38.0) |
Total |
212 |
68 |
98 |
103 |
481 |
Of the 212 respondents that use barrier method, 19.9% opined that they always use it, 32.1% and 50.0% affirmed that they sometimes or rarely use barrier method of contraception. Also, out of 68 women that use hormonal method of contraception, 27.9% opined that they always use it. Out of 98 and 103 women that use LARC or F/A method of contraception, 51.0% and 19.4% affirmed that they always use them respectively. Summarily, out of 481 women, 26.4% opined that they always use any of the methods of contraceptive listed herein whereas 35.6% and 38.0% affirmed that they sometimes or rarely use any of the methods listed herewith.
Table 4. Influence of Socio-Demographic Variables and Contraceptive Choice among the Women (N = 481)
Variables |
Barrier (%) |
Hormonal (%) |
LARC (%) |
F/A (%) |
Chi-square (x2) value |
Decision |
|
Age (Years)
Below 25
25 – 29
30 – 34
35 – 39
40 and above |
17 (37.0)
41 (38.3)
111 (65.7)
37 (27.0)
6 (27.3) |
6 (13.0)
18 (16.8)
10 (5.9)
30 (21.9)
4 (18.2) |
2 (4.3)
15 (14.0)
29 (17.2)
42 (30.7)
10 (45.4) |
21 (45.7)
33 (30.9)
19 (11.2)
28 (20.4)
2 (9.1) |
94.12; P < 0.05 |
Significant |
|
Education
Primary
Secondary
Tertiary |
5 (22.7)
160 (57.8)
47 (25.8) |
3 (13.6)
41 (14.8)
24 (13.2) |
13 (59.1)
61 (22.0)
24 (13.2) |
1 (4.6)
15 (5.4)
87 (47.8) |
114.12; P < 0.05 |
Significant |
|
No. of Children
1 – 2
3 – 4
5 – 6
7 and above |
37 (37.4)
58 (49.2)
96 (50.5)
21 (28.4) |
10 (10.1)
17 (14.4)
13 (6.9)
28 (37.8) |
2 (2.0)
5 (4.2)
69 (36.3)
22 (9.7) |
50 (50.5)
38 (32.2)
12 (6.3)
3 (4.1) |
179.12; P < 0.05 |
Significant |
|
Religion
RCM
Anglican
Pentecostals
Others |
153 (53.1)
45 (32.4)
12 (27.9)
2 (18.1) |
20 (7.0)
31 (22.3)
13 (30.2)
4 (36.4) |
24 (8.3)
55 (39.6)
15 (34.9)
4 (36.4) |
91 (31.6)
8 (5.7)
3 (7.0)
1 (9.1) |
129.2; P < 0.05 |
Significant |
|
Occupation
Civil service
Trading/Farming
Self employed
Unemployed |
41 (40.2)
103 (50.7)
52 (42.6)
16 (29.6) |
16 (15.7)
27 (13.3)
16 (13.1)
9 (16.7) |
31 (30.4)
43 (21.2)
7 (5.8)
17 (31.5) |
14 (13.7)
30 (14.0)
47 (38.5)
12 (22.2) |
50.32; P < 0.05 |
Significant |
|
Marriage
Monogamy
Polygamy |
173 (46.5)
39 (35.8) |
49 (13.2)
19 (17.4) |
70 (18.8)
28 (25.7)) |
80 (21.5)
23 (21.1) |
50.32; P < 0.05 |
Not Significant |
The findings of this study revealed that those with secondary (57.6%) and tertiary (37.8%) education were higher in the study which indicates that the level of educational qualification has a significant role to play in contraceptive usage. The finding of this research established that women with higher education are more likely to use contraceptives than their counterparts in secondary school and those in secondary are likely to use contraceptives than those with primary education. The study further revealed that there is statistical association between level of education and choice of contraceptive usage among women in Akpulu. This finding is similar to that of Rahman & Kabir which indicated that the level of education of respondents has a significant role in the usage and choice of contraceptives [15]. The finding of this study is also similar to the study finding of Dynes, Stephenson, Rubardt & Bartel which emphasized that women with higher level of education have a better chance of using and choosing modern contraceptives than their counterparts in the lower educational cadre [13].
The findings of this study establish age, number of children; religious affiliation, occupation and level of education are statistically related with the usage and choice of contraceptives among women in Akpulu, Ideato North Local Government Area, and Imo State, Nigeria. This finding conforms to that of Sabo et al findings, that level of education; occupation and age of their respondents are statistically associated with choice of contraceptive usage [14]. This implies that occupation, age, number of children religious affiliation plays major roles in choice and usage of contraceptives. It is worthy to note that respondents that are Catholics (RCM) are more than other religious affiliation. This explains the findings which indicated that most of them (RCM) use barrier method (53.1%) and fertility awareness method (31.6%). This finding is in line with that of Nakiboneka & Maniple which revealed that Catholics oppose the use of artificial family planning especially, pills, implants, intrauterine devices and permanent contraception. This shows that in all religious categories, RCM respondents preferred fertility awareness (natural family planning) method [16].
The study further revealed that type of marriage (monogamy or polygamy) does not have influence on choice of contraceptive usage among the respondents. It worthy to note that out of 481 respondents, few (26.4%) of them indicated that they always use contraceptive as against 35.6% and 38.0% who opined that they sometimes or rarely use contraceptives respectively. This finding conforms to that of Creanga, Gillespie, Karklins & Tsui who found out that use of contraception remained low to moderate levels among their respondents [17].
The result of the study indicated that the socio-demographic variables (age, level of education, number of children, religious affiliation and occupation) of the respondents have significant role in the choice of contraceptives among the women in Akpulu, Ideato North Local Government Area, Imo State, Nigeria.
The researcher is grateful to the Traditional Ruler, Village Heads, Women Leaders in different villages and kindreds, and the women in Akpulu, Ideato North Local Government Area, Imo State, Nigeria.
- Helena A, Otupiri E (2016) Preventing repeat abortions among women in Kumasi. American J Pub Hlt Res 4: 8-15. [Crossref]
- Fallis A (2013) Factors influencing the utilization of family planning service. J Chemo Infect Model 53: 1689-1699. [Crossref]
- World Health Organization (2015) Trends in maternal mortality: 1990 to 2015. Estimates by WHO, UNICEF, UNFPA, World Bank and the United Nations Population Division. Geneva, Switzerland. [Crossref]
- World Health Organization (2015) Family Planning/Contraception: WHO, Media Centre. [Crossref]
- Sedgh G, Singh S, Hussain R (2014) Intended and Unintended Pregnancies Worldwide in 2012 and Recent Trends. Studies on Family Planning 45: 301-314. [Crossref]
- Vincent CC (2018) Community health care practice in developing countries. Owerri: Springfield Publishers Ltd.
- Audu BM, Takai UI, Bukar M (2010) Trends in maternal mortality at University of Maiduguri teaching hospital, Maiduguri, Nigeria-a five year review. Nigeria Medical Journal 51: 147-151.
- Ankomah A, Anyanti J, Oladosu A (2011) Myths, misinformation, and communication about family planning and contraceptive use in Nigeria. Open Access J Contracept 2: 95-105. [Crossref]
- Yue K, O Donnell C, Sparks PL (2010) The effect of spousal communication on contraceptive use in Central Terai, Nepal. Patient Edu Counse 81: 402-408. [Crossref]
- Mosha I, Ruben R, Kakoko D (2013) Family planning decisions, perceptions and gender dynamics among couples in Mwanza, Tanzania: a qualitative study. BMC Pub Hlth 13: 523. [Crossref]
- Asekun Olarinmoye EO, Adebimpe WO, Bamidele JO, et al. (2013) Barriers to use of modern contraceptives among women in an inner-city area of Osogbo metropolis, Osun state, Nigeria. Intl J Women's Hlth 5: 647. [Crossref]
- Stephen AA, Enoch PM (2014) Modern contraceptive use, sex refusal, spousal difference in level of education among married women in Nigeria: Are they interrelated? Intl J Hum 4: 217-230. [Crossref]
- Dynes M, Stephenson R, Rubardt M, et al. (2012) The influence of perceptions of community norms on current contraceptive use among men and women in Ethiopia and Kenya. Health Place 18: 766-773. [Crossref]
- Sabo AS (2018) Influence of socio-demographic variables on the choice of contraceptives among women attending ANC unit at specialist hospital Sokoto, Sokoto State, Nigeria. Intl J Repr Contra Obstet and Gyne 7: 2565-2572.
- Rahman MM, Kabir M (2005) Knowledge of adolescents on contraception and dynamics of its use. Health and Population: Perspectives and Issues 28: 164-177. [Crossref]
- Nakiboneka C, Maniple E (2008) Factors related to the uptake of natural family planning by clients of Catholic health units in Masaka diocese, Uganda. Health Policy and Development 6: 126-141. [Crossref]
- Creanga AA, Gillespie D, Karklins S, et al. (2011) Low use of contraception among poor women in Africa: an equity issue. Bull World Health Organ 89: 258-266. [Crossref]