Purpose: To elucidate optical coherence tomography features that may be predictive of visual outcomes after phacoemulsification in eyes with a primary and secondary Epiretinal Membrane (ERM).
Patients and methods: Retrospective consecutive case series. Visual Acuity (VA) and Spectral-Domain Optical Coherence Tomography (SD-OCT) characteristics at pre-operative and post-operative visits in eyes with pre- existing ERM that underwent uncomplicated phacoemulsification were analyzed.
Results: In the 57 eyes, median VA improved significantly from 20/50 at baseline to 20/30 at 1, 3, 6, and 12 months (all p <0.001). VA improved by at least 3 lines in 45% to 58% of eyes at each time point. Mean OCT Central Foveal Thickness (CFT) was 335 μm at baseline and increased by 33 μm (p<0.001), 17 μm (p=0.005), 36 μm (p=0.018), and 11 μm (p=0.18) at 1, 3, 6, and 12 months, respectively. Cystoid macula edema was typically treated with topical steroidal and nonsteroidal medications. Intact Inner-Outer Segment (IS/OS) junction at the preoperative visit was a statistically significant positive predictor of higher visual improvements, while intact foveal pit and preoperative CFT were not. There was no difference between the primary and secondary ERMs in terms of visual improvements or CFT at any time point.
Conclusions: Given significant visual improvements and mild, transient retinal thickening increase without significant membrane progression through 1 year, phacoemulsification alone may be recommended in eyes with preexisting ERMs. No OCT characteristic, other than intact IS/OS junction, was a significant predictor of better long-term visual improvements.
Epiretinal Membrane (ERM); Cataract Extraction; Optical Coherence Tomography (OCT); Phacoemulsification
A recent large-scale study reported that phacoemulsification in eyes with idiopathic or primary Epiretinal Membrane (ERM) leads to approximately 3 Snellen lines improvement; however, higher rates of cystoid macular edema and a lower visual gain compared to eyes without primary ERM were documented [1]. Unfortunately, this big-data study was based on coding and not on Optical Coherence Tomography (OCT) analysis, and thus the authors were unable to analyze anatomy in relation to visual outcomes or grade the severity or worsening of ERM after cataract extraction. The literature on the effects of cataract surgery on epiretinal morphology is scarce; however, some studies reported worsening of pre-existing ERMs [2,3] and an increased risk of pseudophakic cystoid macular edema in the context of ERMs [4-6].
It is estimated that 30 million people in the United States have an ERM in at least one eye, [7] and the condition affects predominantly older patients [8] causing significant morbidity [9]. ERMs can be classified as idiopathic or secondary, depending on their etiology. Idiopathic primary ERMs are thought to arise after the development of an anomalous Posterior Vitreous Detachment (PVD), [10] while secondary ERMs may arise with conditions affecting the vitreoretinal interface such as posterior uveitis, trauma, diabetic retinopathy, laser retinopexy, and retinal detachment repair [11,12]. In a study analyzing the anatomic OCT characteristics of primary versus secondary ERMs, it was found that secondary.
ERMs were more likely to have focal adhesions to the retina as compared to primary ERMs, which tended to be diffusely adherent to the underlying retina [13,14]. Therefore, tractional forces may be different in these two groups, which could impact macular morphology change after intraocular surgery.
Current published literature explores changes in visual acuity as well as in central macular thickness and macular volume without detailed analysis of retinal layers morphology, comparison of primary to secondary ERMs, or anatomic factors predictive of visual improvements after phacoemulsification in eyes with preexisting ERMs [1-4,15,16]. In fact, neither the natural history of ERMs after cataract extraction nor OCT prognostic factors for visual outcomes after phacoemulsification have been well studied. This is a clinically significant question since the surgical approach to ERMs is frequently debated. If ERMs progress quickly after cataract extraction, there may be an argument to attempt combined phacoemulsification/ERM peeling. Otherwise, a sequential approach would be rational. Knowing prognostic factors of ERMs before cataract extraction may help with patient counseling and better surgical approach selection for the individual patient. In the current study, we explored the macular morphology before and after phacoemulsification in the presence of primary and secondary ERM, and correlated visual outcomes with OCT features in these eyes.
This retrospective consecutive case series was approved by the Miami Veterans Affairs IRB and was compliant with the Health Insurance Portability and Accountability Act. Consecutive eyes with pre-existing ERM documented by pre-operative Spectral-Domain Optical Coherence Tomography (SD-OCT) undergoing phacoemulsification, over a span of three years, were identified and the charts were reviewed. Patients with pre-existent ERM that had undergone combined phacoemulsification and ERM peeling, or phacoemulsification with any intraoperative complications such as vitreous loss were excluded. Best- corrected Snellen visual acuity (BCVA) and SD-OCT characteristics at pre- operative and post-operative visits (1, 3, 6 and 12 months) were collected and analyzed. Refractions were done at preoperative examination and at 1-month post-operative visit. The 3-month acuity testing was typically measured with the 1-month’s refraction and additional refractions were done at 6 and 12 months post-operatively. The SD-OCTs were routinely obtained at preoperative and 1, 3, 6, and 12-month postoperative visits per our clinical protocol.
All scans were obtained with the same SD-OCT device (Cirrus, Carl Zeiss Meditec Inc., Dublin, CA). Central Foveal Thickness (CFT) was determined as the value of the innermost circle in the macular thickness protocol. Presence of fluid using OCT was reported as none, subretinal, or intraretinal. The foveal contour was graded as normal or abnormally shaped. The Inner Segment-Outer Segment (IS/OS) junction of the central macular photoreceptors was graded as intact or disrupted at the preoperative visit. The ERM was graded as diffusely adherent (no separation between the membrane and the retina) or focally adherent (characterized by focal separations between the membrane and the retina seen on the OCT) as previously defined [13,14]. The etiology of the ERM was also recorded as primary/idiopathic or secondary (i.e. in the context of another pre-existing retinal condition such as diabetic retinopathy, history of retinal detachment, trauma, retinal breaks, lattice degeneration with retinal holes, age-related macular degeneration or vein occlusion) [13,14]. Subsequent adjuvant treatments and surgical procedures were recorded.
Statistical analysis was performed using SPSS Version 24.0 (IBM Corp., Armonk, NY, USA) and SAS Version 9.4 (Cary, NC, USA). Visits were classified into follow-up examination windows, defined as: 1 month (3-6 weeks); 3 months (2-4 months); 6 months (5-7 months), and 12 months (9-13 months). If more than one visit occurred within a follow-up window, the one closest to the defined interval visit was selected for analysis. For the purpose of calculating differences in visual acuity, Snellen visual acuities were converted into approximate Early Treatment Diabetic Retinopathy Study (approxETDRS) letter scores as previously described [17]. Changes in visual acuity and OCT measurements from baseline at the various follow-up endpoints were compared to the preoperative values of the same eyes by the paired t-test. Univariate analysis was performed to evaluate the difference in approxETDRS letters among multiple groups (e.g. grouping OCTs by certain criteria compared to baseline). Pearson correlation coefficients were used to evaluate the strength of relationship between variables (e.g., CFT and BCVA). Conditional logistic regression was used to determine if there was a correlation between ERM type (primary or secondary) and attachment (diffuse or focal). A p-value of 0.05 or less was considered statistically significant.
Fifty-seven consecutive eyes met criteria as defined above and were included. All postoperative visits reached by patients at 1-, 3-, 6-, and 12-month time point were analyzed. Consistent with the predominantly older, male patient population of the Veteran Affairs hospital, 55 out of 57 (96%) patients were male and the mean age was 73 ± 7.2 years. Demographics, including secondary diagnoses, are shown in Table 1.
Table 1. Demographic Data of the patients included in the analysis
Gender |
Male: Female |
55 (96%): 2 (4%) |
Age |
Mean ± SD; Median [range] |
73 ± 7.2; 73[53, 88] |
Study Eye |
OD: OS |
33 (58%): 24 (42%) |
Diagnosis prior to phacoemulsificationa |
ERM |
57 (100%) |
NPDR without DME PDR (quiescent) Glaucoma |
7 (12.3%)- secondary ERM |
Dry AMD PXF |
4 (7.0%)- secondary ERM |
Remote blunt trauma Retinal detachment repair Retinal Hole (observed) |
8 (14%) |
Lattice Degeneration with holes Retinal tear (h/o laser demarcated) BRVO |
5 (8.8%)- secondary ERM |
|
3 (5.3%) |
|
2 (3.5%)- secondary ERM |
|
2 (3.5%)- secondary ERM |
|
1 (1.8%)- secondary ERM |
|
1 (1.8%)- secondary ERM |
|
1 (1.8%)- secondary ERM |
|
1 (1.8%)- secondary ERM |
a Some eyes had more than one diagnosis in addition to epiretinal membrane
Abbreviations: AMD- age-related macular degeneration; ERM- epiretinal membrane; BRVO- branch retinal vein occlusion; NPDR-nonproliferative diabetic retinopathy; PDR- proliferative diabetic retinopathy; PXF- pseudoexfoliation.
Visual and Anatomic Results after Phacoemulsification
Median Snellen VA was 20/50 at baseline and improved to 20/30 at each follow- up visit through 12 months (Table 2). The scatter plots of baseline VA versus VA at 1, 3, 6, and 12 months demonstrate the clustering of points above the line of equality indicating that most visual acuities improved after surgery (Figure 1).
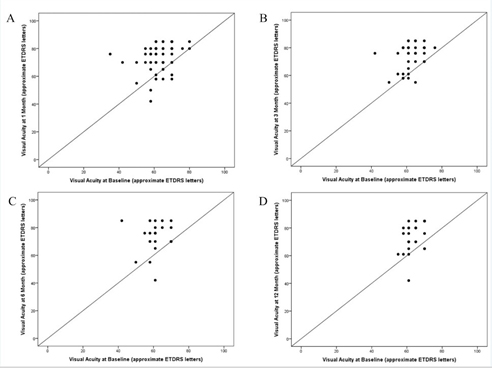
Figure 1. Scatter plots of visual acuity at baseline versus follow-up after phacoemulsification.
- Scatter plot of visual acuities at 1 month versus baseline.
- Scatter plot of visual acuities at 3 months versus baseline.
- Scatter plot of visual acuities at 6 months versus baseline.
- Scatter plot of visual acuities at 12 months versus baseline.
The plots demonstrate the clustering of points above the line of equality indicating that most visual acuities improved after surgery. Dots may represent several overlapping data points.
At the preoperative visit, the mean OCT CFT for all eyes was 335±70 μm (median: 326; range: 171-574; N=53). Comparisons of CFT measurements for eyes seen at each follow-up period to their baseline CFT values are listed in Table 2. The scatter plot of baseline CFT versus CFT at 1, 3, 6, and 12 months demonstrate the clustering of points just above or near the line of equality indicating that most retinal thicknesses either remained the same or increased slightly (Figure 2). The CFT and average OCT thickness remained stable (defined here as within 100 μm of baseline) in 49 out of 53 (92%) and all 53 (100%) eyes at 1 month, all 36 (100%) and 36 (100%) eyes at 3 months, 22 out of 24 (92%) and all 24 (100%) eyes at 6 months, and 26 out of 27 (96%) and all 27 (100%) eyes at 12 months, respectively. Eyes with stable CFT had significantly better VA improvement compared to the few eyes in which OCT worsened by more than 100 μm from baseline at 1, 6, and 12 months (p=0.032, p=0.001, p=0.001, respectively).
Table 2. Visual Acuity and OCT Central Foveal Thickness Measurements at Baseline and Through Month 12
|
Follow-up Interval |
Month 1 |
Month 3 |
Month 6 |
Month 12 |
|
approxETDRS† Mean±SD |
63±8 |
62±6 |
62±7 |
63±4 |
|
approxETDRS Median[range] |
65[35,80] |
61[42,76] |
61[42,70] |
61[55,70] |
Baseline VAa |
Snellen Median VAa |
20/50 |
20/60 |
20/60 |
20/60 |
|
Snellen [range] |
[20/25,20/200] |
[20/30,20/150] |
[20/40,20/150] |
[20/40,20/80] |
|
N eyes |
N=57 |
N=40 |
N=26 |
N=30 |
|
approxETDRS Mean±SD |
74±9 |
73±10 |
74±11 |
73±10 |
|
approxETDRS Median[range] |
76[50,85] |
76[50,85] |
76[42,85] |
76[42,85] |
Follow-Up VA |
Snellen Median VA |
20/30 |
20/30 |
20/30 |
20/30 |
|
Snellen [range] |
[20/20, 20/100] |
[20/20,20/100] |
[20/20,20/150] |
[20/20,20/150] |
|
N eyes |
N=57 |
N=40 |
N=26 |
N=30 |
|
approxETDRS mean letters |
11±10; |
11±10; |
12±12; |
10±9; |
|
improved±SD from preoperative visit |
P<0.001 |
P<0.001 |
P<0.001 |
P<0.001 |
Change in VAb |
|
|
|
|
|
|
3-line improvement: N (%) |
28 (49%) |
18 (45%) |
15 (58%) |
15 (50%) |
|
3-line loss: N (%) |
0 (0%) |
1 (3%) |
1 (4%) |
1 (3%) |
a Baseline Snellen Visual Acuity (VA) and Optical Coherence Tomography (OCT) Central Foveal Thickness (CFT) measurements for those patients who returned at each time point. Refractions were done at preoperative examination and at 1-month post-operative visit. The 3-month acuity testing was typically measured with the 1-month’s refraction and additional refractions were done at 6 and 12 months post-operatively.
b paired t-test
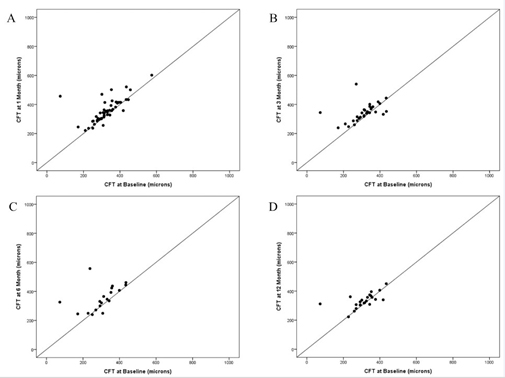
Figure 2. Scatter plots of Optical Coherence Tomography (OCT) central foveal thickness (CFT) at baseline versus follow-up after phacoemulsification.
- Scatter plot of OCT Central Foveal Thickness (CFT) at 1 month versus baseline.
- Scatter plot of OCT Central Foveal Thickness (CFT) at 3 months versus baseline.
- Scatter plot of OCT Central Foveal Thickness (CFT) at 6 months versus baseline.
Scatter plot of OCT Central Foveal Thickness (CFT) at 12 months versus baseline.
The plots demonstrate the clustering of points near the line of equality indicating that most retinal thicknesses either remained the same or increased only slightly. Dots may represent several overlapping data points.
Retinal thickening on postoperative OCT was managed with topical drops. Per our protocol, all patients started topical prednisolone and ketorolac after surgery, typically 4 times daily, and tapered them off during the first month after uncomplicated phacoemulsification. At 1 month, if retinal edema was seen on the OCT, the patients continued the drops with various regimens per treating physician’s discretion. Overall, 15 out of 57 (26%), 8 out of 40 (20%), 4 out of 26 (15%), and 2 out of 30 (7%) eyes were continued on the topicals at 1, 3, 6, and 12 months. In addition, three eyes received adjuvant intravitreal injections.
post-operatively: one eye for diabetic macular edema (three bevacizumab injections), second eye for postoperative choroidal neovascular membrane (two bevacizumab injections), and third eye for Irvin-Gass intraretinal fluid (one bevacizumab). One patient chose to undergo Pars Plana Vitrectomy (PPV) with ERM peeling despite improvement on topical medications. This patient’s vision decreased from 20/70 pre-operatively to 20/150 at month 1 due to increased Intraretinal Fluid (IRF), and then returned to 20/70 by month 3 with topical medications. However, at month 4 the patient chose to undergo membrane peeling and his BCVA improved to 20/40 postoperatively.
Primary versus Secondary Epiretinal Membranes
Subgroup analysis of patients with pre-existing primary (n=43, 75.4% eyes) and secondary (n=14, 24.6% eyes) ERMs was performed. Pre-existing retinal conditions of patients with secondary ERMs are outlined in Table 1.
Baseline median BCVA was 20/50 (mean 64 ± 8 approxETDRS letters) in the primary ERM group versus 20/60 (mean 62 ± 5 approxETDRS letters) in the secondary ERM group (p=0.40). There was no difference in VA improvements between the groups at any follow-up period (p-values 0.89, 0.75, 0.24, and 0.25 at 1, 3, 6, and 12 months).
Baseline OCT average thickness was 294±30 μm in the primary ERM group versus 280±43 μm in the secondary ERM group (p=0.18). There was no difference in the increase in OCT average thickness between the groups at any follow-up period (p-values 0.30, 0.65, 0.94, 0.44 at 1, 3, 6, and 12 months).
Diffusely Adherent versus Focally Adherent Epiretinal Membranes
The distribution of diffusely versus focally adherent ERMs in the primary and secondary ERM groups was analyzed. There was no statistically significant difference in the adherence patterns between the primary and secondary ERM groups at any time point (p-values 0.32, 0.86, 0.26, 0.74, 0.07 at baseline, 1, 3, 6, and 12 months). However, for the ERMs that were initially diffusely adherent at baseline, there was a statistically significant transition from diffuse to focal adherence within each group (primary and secondary ERM) at each time point, with all p-values less than 0.001.
Cystic Intraretinal Fluid in Diffusely Adherent and Focally Adherent Epiretinal Membranes
Cystic Intraretinal Fluid (IRF) was seen with both diffusely and focally adherent ERMs. The combined proportion of eyes with visible cysts in both groups was 6 out of 57 (11%), 19 out of 53 (36%), 10 out of 36 (28%), 5 out of 24 (21%), and 2 out of 27 (7%) at baseline, 1, 3, 6, and 12 months respectively. Although the percentage of eyes with cystic fluid increased in both groups from baseline, the diffusely adherent membranes did not disproportionally lead to development of cystoid macular edema compared to the focally adherent ERMs (p-values 1.00, 0.09, 0.59, 0.82, 0.52 at baseline, 1, 3, 6, and 12 months). When cystic intraretinal fluid (IRF) was present, it was located in the Inner Nuclear (INL), Outer Plexiform (OPL) or Outer Nuclear Layer (ONL). Subretinal fluid was seen in three eyes at preoperative visit and remained stable. One eye developed subretinal fluid postoperatively due to a new choroidal neovascular membrane.
Correlation between Preoperative OCT Features and Visual Acuity Improvement after Phacoemulsification
Comparing eyes with intact versus disrupted subfoveal IS/OS junction on preoperative OCT, the eyes with intact IS/OS line demonstrated significantly larger improvements in approxETDRS letters from preoperative vision at all time points other than 1 month (p-values were 0.178, 0.024, <0.001, and 0.05 at 1, 3, 6, and 12 months), and all statistically significant differences between the two groups were more than 5 ETDRS letters or at least one Snellen line. Vision improved with intact IS/OS junction (mean improvement of 12.1-15.3 approxETDRS letters) and with disrupted IS/OS junction (mean improvement of 6.3-9.9 approxETDRS letters) at all time points.
Comparing eyes with present versus absent foveal pit on preoperative OCT, no significant differences in approxETDRS letter change from preoperative vision were found at any follow-up periods other than at 6 months (p-values were 0.193, 0.377, <0.001 -in favor of absent foveal pit, 0.794 respectively), and all differences between the two sets of eyes were fewer than 5 ETDRS letters or one Snellen line. Thus, vision improved in eyes with present foveal pit (mean improvement of 9.9- 12.4 approxETDRS letters) and with absent foveal pit (mean of 8.8-14.6 approxETDRS letters), and the status of foveal pit made no significant difference.
The correlation coefficients between preoperative CFT and vision improvement were not significant: -0.247 (p=0.064), -0.229 (p=0.16), 0.256 (p=0.21) and 0.169 (p=0.38) at 1, 3, 6, and 12 months, respectively.
To further explore the relationship between preoperative CFT and BCVA improvement, the eyes with significant preoperative thickening of the macula, arbitrarily defined as baseline OCT CFT of 300 μm or more (n=39), were compared to eyes with baseline CFT of less than 300 μm (n=18). Student t-test revealed significantly more improvement in approximate ETDRS letters in the eyes with thinner than 300 μm baseline OCTs at month 1 (p=0.01) and month 3 (p=0.054) but not at month 6 (p=0.39) or month 12 (p=0.99).
In the current study, phacoemulsification in eyes with preexisting ERM resulted in significant visual improvements through 1 year, with approximately half of the eyes having gained at least 3 lines at each follow-up visit, compared to baseline. While there was a mild (<50 μm), transient increase in CFT at months 1, 3 and 6, retinal thickness was not significantly different from baseline at 1-year. Increase in retinal fluid was managed with topical steroidal and nonsteroidal medications. Intact IS/OS junction at the preoperative visit was a positive predictor of higher visual improvements after surgery through year 1, although visual acuity improvements were also seen in eyes with disrupted IS/OS junction. Central macular thickness, presence of foveal pit, ERM diffuse or focal adherence pattern, primary versus secondary nature of ERM made no difference in terms of visual outcomes or rates of cystoid macular edema development.
The CFT remained within 100 μm of baseline in 92-100% eyes throughout the follow-up period. Remarkably, baseline CFT did not show significant correlation with visual acuity improvements at 1 year, even in the eyes with baseline central thickness of above 300 μm, suggesting that a pre-existing ERM with a thicker retina did not preclude visual acuity improvements after phacoemulsification. Since vision improved and the retinal anatomy did not seem to be negatively impacted by phacoemulsification, it may be worthwhile to remove the cataract and then assess visual acuity improvements prior to proceeding with ERM peeling. In fact, should the patient require ERM peeling in the future, the retinal surgeon’s view through a lens implant will be crisper and the shift from diffuse to focal adhesion pattern after phacoemulsification, documented in the current study, should make lifting the membrane easier. In both the primary and secondary ERM groups in the current study, there was a statistically significant transition from diffuse to focal adherence from month 1 through month 12, indicating that the diffusely adherent membranes may separate from the surface of the retina with time, which would be expected to make it easier to separate the membrane from the retina. It is unclear if phacoemulsification itself or the postoperative inflammation played a role in this transition. Naturally, the patient should be counseled by the cataract surgeon about the presence of ERM and the possibility that vision may not improve sufficiently after phacoemulsification, and that a referral to a vitreoretinal surgeon may always be done if necessary. Interestingly, an intact IS/OS junction, which was found to be a positive predictor of better long-term visual improvements in our study, was also shown a preoperative prognostic factor in patients operated on for combined cataract and idiopathic epiretinal membrane [18].
In a recent study, Hamoudi et al. reported similar final BCVA and macular thickness at 12 months among eyes with an ERM treated with any approach, i.e. sequential cataract extraction followed by PPV, initial vitrectomy and subsequent cataract extraction, or combined phacoemulsification and PPV [15]. While the paper does not specify the criteria for the decision to peel the membrane after cataract extraction, the authors report that in 17% of their cases treated with cataract surgery first, no subsequent vitrectomy was necessary due to patient satisfaction with vision. The difference in percentage of patients needing membrane peeling from our study (only one patient undergoing membrane peeling within 12 months in the current study) may be due to surgeons’ preference, patients’ expectations, or more significant retinal distortion due to ERM compared to our study. The baseline CFT in Hamoudi’ s cataract extraction first group was 489 +/- 86 microns, compared to 335 +/- 70 microns in our study population. Regardless, the authors recommend to start by removing the cataract in cases with concomitant cataract and then make the decision regarding membrane peeling at 1-month or later after cataract extraction.
Our data revealed an improvement of at least 3 Snellen lines in approximately half of the eyes, and this rate is corroborated by a recent large data study by Hardin et al, analyzing 812 eyes with primary ERMs [1]. The authors found an improvement by at least 3 Snellen lines in 44.6% ERM eyes at 4-12 weeks after uncomplicated phacoemulsification [1]. No OCT data was available in that study as it was based solely on clinical coding. Nevertheless, cystoid macular edema was coded in 8.6% ERM eyes compared to 1.38% control eyes (p<0.001) after cataract surgery, and lower postoperative VA gains were noted in ERM eyes compared to control eyes. ERM peeling was performed in 6.5% of ERM eyes in that study [1]. Other studies also suggested that patients with pre-existing ERMs are more likely to develop macular edema following cataract surgery, and thus should be monitored with OCT postoperatively [2,4-6,15]. In a retrospective study of 81984 eyes published in 2016, eyes with pre-existing ERM had 5.50 times increase in the relative risk of developing pseudophakic macular edema after cataract extraction, which correlated with poorer visual acuity outcomes [4]. Tsilimbaris et al. reported a significant increase in mean foveal thickness at 1, 3, and 6 months after uncomplicated phacoemulsification in eyes with pre- existing ERM [16]. The mean foveal thickness showed a rise from baseline at 1 month after surgery and then gradual regression through 6-month follow-up.
Despite thickening, BCVA improved significantly in eyes with and without pre- existing ERM at all postoperative follow-ups [16].
In our opinion, patients should be counseled about a possibility of macular edema after cataract extraction, especially in the presence of an ERM, due to compromise of the blood-ocular barrier and release of pro-inflammatory cytokines leading to increased vascular permeability [5]. In the current study, the CFT was significantly increased at 1, 3, and 6 months. Looking at individual cases in the current study, two different scenarios are evident (Figure 3). Some patients with preexisting membrane did not show any changes on the OCT following cataract extraction (Figure 3, Patient 1). In contrast, other patients had a transient thickening in the retina at month 1, which improved later in the postoperative period (Figure 3, Patient 2). This transient increase in retinal thickening was typically mild. Patients were managed with topical prednisolone acetate and ketorolac drops, and with time the number of eyes treated with drops decreased, from 26% at 1 month to just 7% at 12 months.
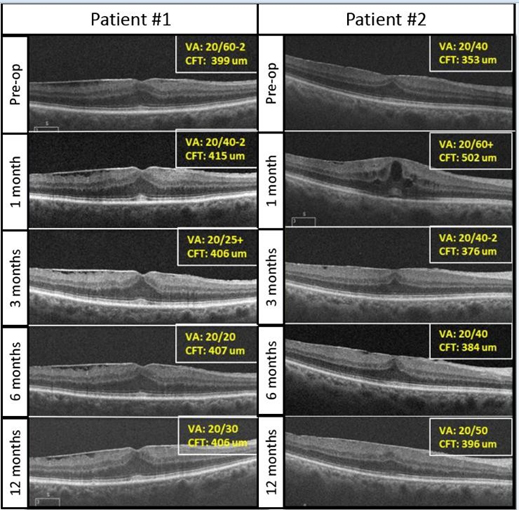
Figure 3. Example of two patients with pre-existing ERMs who underwent uncomplicated phacoemulsification.
The first patient (Patient #1) had a stable ERM and Central Foveal Thickness (CFT) throughout follow-up. His visual acuity improved from 20/60-2 to 20/30 at 1-year. The second patient (Patient #2) had a transient increase in CFT, which improved by 3 months on topical prednisolone and ketorolac drops and remained stable at 1 year. Snellen visual acuity transitioned from 20/40 at pre- operative visit to 20/50 at 1 year
The current study carries the typical limitations of a retrospective study including a small cohort and lack of control group. We included all available data but not all patients returned for every follow-up visit, thus the number of eyes seen at 3, 6, and 12 months were less than the initial group seen at baseline and 1 month. To mediate this fact, the VAs and OCTs obtained at each time point were compared to the baseline values of those patients only. The reader should keep in mind, however, that each point is a cross sectional survey of the available measurements and not the data from all 57 eyes.
Furthermore, the study was not designed to compare visual or refractive outcomes of sequential versus combined procedures, which may be an interesting future study.
We show that removing cataract in eyes with ERMs frequently results in significant visual improvement without worsening of macular morphology through 1 year, and thus cataract extraction should not be withheld in such eyes. No OCT characteristic, other than an intact preoperative IS/OS junction, was a significant predictor of better long-term visual improvements.
This work was supported by NIH Center Core Grant [P30EY014801]; Research to Prevent Blindness Unrestricted Grant; Department of Defense Grant [W81XWH-09-1-0675]. The sponsor or funding organization had no role in the design and conduct of the study; collection or interpretation of the data; and preparation or approval of the manuscript. None of the authors has conflicts of interest pertaining to this work.
Contents of this article have been presented at the 2018 Retina Society Annual Meeting in San Francisco, CA.
- Hardin JS, Gauldin DW, Soliman MK, Chu CJ, Yang YC, et al. (2018) Cataract Surgery Outcomes in Eyes With Primary Epiretinal Membrane. JAMA Ophthalmol. 136:148-154. [Crossref]
- Kopsachilis N, Carifi G, Cunningham C (2015) Rapid exaggeration of a pre- existing epiretinal membrane following uneventful cataract surgery. Clin Exp Optom. 98:94-96. [Crossref]
- Dugas B, Ouled-Moussa R, Lafontaine PO, Guillaubey A, Berrod JP, et al. (2010) Idiopathic epiretinal macular membrane and cataract extraction: combined versus consecutive surgery. Am J Ophthalmol. 149:302-306. [Crossref]
- Chu CJ, Johnston RL, Buscombe C, Sallam AB, Mohamed Q, et al. (2016) Risk Factors and Incidence of Macular Edema after Cataract Surgery: A Database Study of 81984 Eyes. Ophthalmology. 123:316-323. [Crossref]
- Henderson BA, Kim JY, Ament CS, Ferrufino-Ponce ZK, Grabowska A, et al. (2007) Clinical pseudophakic cystoid macular edema. Risk factors for development and duration after treatment. J Cataract Refract Surg. 33:1550-1558. [Crossref]
- Schaub F, Adler W, Enders P, Koenig MC, Koch KR, et al. (2018) Preexisting epiretinal membrane is associated with pseudophakic cystoid macular edema. Graefes Arch Clin Exp Ophthalmol. 256:909-917. [Crossref]
- Meuer SM, Myers CE, Klein BE, Swift MK, Huang Y, et al. (2015) The epidemiology of vitreoretinal interface abnormalities as detected by spectral-domain optical coherence tomography: the beaver dam eye study. Ophthalmology. 122:787-795. [Crossref]
- Fraser-Bell S, Guzowski M, Rochtchina E, Wang JJ, Mitchell P (2003) Five-year cumulative incidence and progression of epiretinal membranes: the Blue Mountains Eye Study. Ophthalmology. 110:34-40. [Crossref]
- Mitchell P, Smith W, Chey T, Wang JJ, Chang A (1997) Prevalence and associations of epiretinal membranes. The Blue Mountains Eye Study, Australia. Ophthalmology. 104:1033-1040. [Crossref]
- Sebag J (2004) Anomalous posterior vitreous detachment: a unifying concept in vitreo-retinal disease. Graefes Arch Clin Exp Ophthalmol. 242:690-698. [Crossref]
- Stevenson W, Prospero Ponce CM, Agarwal DR, Gelman R, Christoforidis JB (2016) Epiretinal membrane: optical coherence tomography-based diagnosis and classification. Clin Ophthalmol. 10:527-534. [Crossref]
- Ng CH, Cheung N, Wang JJ, Islam AF, Kawasaki R, et al. (2011) Prevalence and risk factors for epiretinal membranes in a multi-ethnic United States population. Ophthalmology. 118:694-699. [Crossref]
- Mori K, Gehlbach PL, Sano A, Deguchi T, Yoneya S (2004) Comparison of epiretinal membranes of differing pathogenesis using optical coherence tomography. Retina. 24:57-62. [Crossref]
- Yazici AT, Alagoz N, Celik HU, Bozkurt E, Alagöz C, et al. (2011) Idiopathic and secondary epiretinal membranes: do they differ in terms of morphology? An optical coherence tomography-based study. Retina. 31:779-784. [Crossref]
- Hamoudi H, Correll Christensen U, La Cour M (2018) Epiretinal membrane surgery: an analysis of 2-step sequential- or combined phacovitrectomy surgery on refraction and macular anatomy in a prospective trial. Acta Ophthalmol. 96:243-250. [Crossref]
- Tsilimbaris M, Diakonis VF, Kymionis GD, Eleftheriadou MI, Fragkiskou S, et al. (2012) Prospective study of foveal thickness alterations after cataract surgery assessed by optical coherence tomography. Ophthalmologica. 228:53-58. [Crossref]
- Gregori NZ, Feuer W, Rosenfeld PJ (2010) Novel method for analyzing snellen visual acuity measurements. Retina. 30:1046-1050. [Crossref]
- Kauffmann Y, Ramel JC, Lefebvre A, Isaico R, De Lazzer A, et al. (2015) Preoperative Prognostic Factors and Predictive Score in Patients Operated On for Combined Cataract and Idiopathic Epiretinal Membrane. Am J Ophthalmol. 160:185-192 e185. [Crossref]