Using nuclear (proton) magnetic resonance spectroscopy (NMRs) and relaxometry (NMRr) were studied fresh and used transformers oils. Changes in the molecular composition content was determined upon oil aging. Dependences of NMR spectra and NMR-relaxation parameters –spin-spin T2i relaxation times were received for transformers oils. Experimental results are interpreted on the base of exchange dynamical model.
Great amounts of used alternating current (AC) transformer oils (TO) is currently increasing. So, the problem of their re-refining becomes particularly urgent and the petrochemical quality standards pertinent to their quality are becoming more stringent. Fresh TO compositions are known to manufacturers, while this information about used oils is unavailable.
We have made an estimation of the chemical composition of fresh (FTO) and used transformer oils (UTO) on the basis of comparative analysis of them using NMRs and NMRr methods. NMR-spectra provides detailed information regarding HC structure of oil and confirm some data obtained by FTIR spectroscopy. 1H NMR spectroscopy is a quantitative analytical method to study aging of motor oil and to get insight into the chemical processes which occur during aging. But high resolution NMR-spectroscopy is, in general, not applicable in industrial environments, because of the large size and big weight of the magnet system, the necessity to use a cryogen, the hazard of stray magnetic fields of superconducting magnets and their high cost1 [1].
NMR-Relaxation Proved its Uniqueness as a Powerful Method Equally Suitable for Refined Scientific Investigations and for routine analysis and control. It has several advantages over others: possibility for simultaneous measurement of several physchemical parameters; nondestructive and non contact opportunity of control and automation, short time of measurement. The international standard test method for hydrogen content of middle distillate petroleum products by low –resolution pulsed NMR-spectroscopy, especially for hydrogen content determination in aviation fuels ASTM D7171-052 [2] was elaborated.
Method of NMR-relaxation offers robustness and analysis rapidity. It gives information about relaxation parameters of the every phase of the ODS: spin-lattice T1i and spin-spin T2i relaxation times, populations of their proton phases P1i and P2i; correlation times tCi (times of life in the molecular position); correlation times between proton exchanges tCei; interatoms distances rij; temperatures TPhi of the phase transitions; degree of the protons phases ordering, derived from relaxation times ratio S = T1i/T2i and others3 [3].
Here we present the study by NMR-methods transformer oils: fresh TO (FTO) GK-1 with the density r20 = 850 kg/m3 and used transformer oil (UTO), which density appeared to become r20 = 874 kg/m3 . The color of FTO is yellow-green, and red of UTO.
Spectra 1Н of fresh I and used II transformer oils GК-1 obtained on Tesla-100 NMR-spectrometer at resonance frequency 100 MHz are presented at Figure 1 and Figure 2 (I and II). Deuterated chloroform (CDCl3) was applied as a solvent.
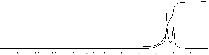
Figure 1. Spectra 1Н of the Fresh Oil GК-1

Figure 2. Spectra 1Н of the used Transformer oil GК-1
From spectra was established, that in UTO compare to FTO spectra summary line intensity of methyl СН3 + methylene –СН2- groups at chemical shifts d ~ 0.7¸1.0 ppm and d ~ 1.3¸1.7 ppm decreased from 84.4% to 77.9% on 6.5%. Average carbon chain length (CL) strongly affects other quality parameters, such as viscosity, higher heating value etc. [4]. Especially, content of –СН2- groups decreased from 52% to 44%, the length of –CH2- chains decreased from CH2/CH3 = 1.604 for FTO to 1/3 for UTO. So the paraffinic hydrocarbons in the FTO are more linear and have longer chains than those in the UTO. In UTO appeared the following substances (which were not present according to NMR-spectra in pure TO: R-CH2-NR-N< and R-CH2-COO- at chemical shifts d ~ 2.3¸2.5 ppm, which spectra line intensity is 0.19% from summary square of lines in spectra; R-СН-СООН and –С-СН2-ОR at d ~ 2.5¸3.0 ppm with intensity 0.33%; was observed great increase of spectra line intensity on 3.3% for aromatics in the wide range of chemical shifts d ~ 6.6¸7.4 ppm.
Were obtained more detailed spectra on the Bruker Avance 400 spectrometer [5]. (Figure 3 and Figure 4).
At figure 3 is presented the part of the NMR-spectra line for water peaks in TO at d = 4.5-4.56 ppm measured at T = 20oC. Here I – for FTO (GKO, 2007); II – TO after 37 years of use, for this sample also temperature was increased to T = 90oC and then after heating for 2 hours, was recorded spectra IIa, then after one hour after cooling the sample to T = 20oC was recorded spectra IIb ; III – FTO after thermotreating during 8.5 houres at temperatures 115¸135oC in glass retort with free access of air; IV – FTO with addition of 0.1 ml of distilled water on 12 ml of oil with following treating by ultrasonic; V – thermo treating analogous to III, but with addition to 100 ml of oil pieces of copper and steel wires. Peak at d = 4.5 ppm correspond to water protons in the true solution in TO, and peak at d = 4.55 ± 0.02 ppm correspond to water molecules, aggregated in drops, dispersed in TO. With increase of temperature to T = 90oC, integral intensity of the peak at d = 4.55 ± 0.02 ppm decreased, but at d = 4.5 ppm increased. This mean, that with temperature increase part of the colloid water decrease and part of soluted water is increased. At cooling takes place the reverse process.
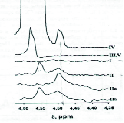
Figure 3. Part of the NMR-Spectra for Water Line in TO at d = 4.5-4.56 ppm
At figure 4 presented part of the NMR-spectra for aromatics in TO at d = 6.25-7.5 ppm in samples I-III. Maximal intensity of peaks have samples II and IIa, minimal – FTO (sample I). In white mineral oil (sample B) signal from aromatics is absent. So it is seen, that increase of exploitation date from 37 to 54 years practically does not influence on arene concentration in 1H1 NMR spectra. It can be explained by grouping of arenes in colloidal and then in solid particles, which then precipitate. It was confirmed [5] by relaxation measurements.
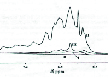
Figure 4. Part of the NMR-Spectra for Aromatics in TO at d = 6.25-7.5 ppm
3. Measurements of NMR-relaxation structure-dynamical parameters.
Spin-lattice T1i, spin-spin T2i relaxation times and their proton populations P1i and P2i are useful for characterization of dynamical processes in oils. For measurements of NMR-relaxation was used designed by us [6] relaxometer NMR-NC-1 with resonance frequency νo =14,34 МHz. Temperature of measurements maintained with accuracy ± 0,2 о at 25 oC by thermo stabilization unit [7].
For T1i and Р1i determination spin-echo recovery sequence 90-t-90о-t0-180о of Hahn was used.. For T2i and Р2i measurements 90о-t- (1800-2t-)N sequence of Carr-Purcell-Mayboom-Gill [8] was applied, eliminating the influence of self-diffusion and protons exchange. Experimental error of measurements was ± 3¸4 % for relaxation times and signal amplitudes recurrence ± 1¸2 %, depending from accumulations number n of NMR-spin-echo amplitudes and error could be decreased in (n)1/2 times using n accumulations. Sample probe head has Æ20 mm, so the sample volume V for probe filling height h = 3,5 cm was V » 11 cm3, large enough to get representative probe. Coefficient of sensibility К = ν2V [МHz2сm3] in our NMR-relaxometer is К = 2250 МHz2сm3, that is near to К = 3970 МHz2сm3 of MARAN-23 (Oxford, UK) with higher frequency ν = 23 МHz, but less probe diameter Æ18 mm and volume 8 cm3.
Spin-echo amplitudes Ае envelopes dependences in Hahn and CPMG-methods after the amplitude detection has forms, described by equations:
Aе (t) = 1 – A0{Р1А exp (-t/T1A) + Р1В exp (-t/T1B)} (1)
Aе (t) = A0{Р2Аexp (-t/T2A) + Р2Вexp (-t/T2B)} (2)
By measurements of transverse magnetization using solid echo (90оx-t- 90оy-t-echo) was observed component, described by equation:
Aе (t) = A0{pC exp (-t2/T2C2) (3)
where Р1А, Р1В, Р2А, Р2В, Р2С correspond to populations of protons, participating in several types of molecular
motions which determine relaxation times T1i and T2i. From measured spin-echo amplitudes data logarithm was taken, and then the curve was decomposed on three linear components, corresponding to relaxation times T1i and T2i with Р1i and Р2i of two proton phases А and В with high and lower mobility of molecular fragments of oils. Besides proton populations obtained from Т1 and Т2 differs (especially for phase A). This will be discussed later.
According to our measurements at temperature T = 25oC, FTO has relaxation times of the phase A equal to T2A = 297±12 ms and T2B = 98±4 ms phase B with corresponding proton populations Р2А = 0.51± 0.02 and Р2В = 0.49 ± 0.02; UTO has T2A = 723±20 ms and T2B = 437±17 ms with proton populations Р2А = 0.92± 0.02 and Р2В = 0.08 ± 0.02.
For all TO characteristic sufficient dependence of relaxation times from distance tКП between 1800 pulses in the range 1400-2000 ms, which corresponds to frequency (tКП)-1 of 1800 pulses. This is inherent to the exchange processes between protons in the A and B phases with chemical shifts dA and dB in this samples. This result together with the fact, that T2A = 297±12 ms and T2B = 98±4 ms in FTO lower, then T2A = 723±20 ms and T2B = 437±17 ms in UTO is the indication, that FTO has colloidal ordered structure, while UTO contain low weighted molecules, perhaps as a result of destruction of aliphatic hydrocarbons (HC) .
Indeed, as it was shown by 1H1 NMR spectra, HC content (methyl -СН3 and methylene –СН2- groups) decreased from 84.4% in FTO to 73.8 % at UTO of (methane and naphthenic molecules) summarily on 10.6%. Also in UTO appeared 3.21% of polyaromatics. Used oil HC are more branched, because the ratio of spectra line intensities between CH3-C /–C-CH2-C groups sufficiently changed from 0.623 in FTO to 0.93 in UTO. The results coincide with results of [9].
At the same time, in the work [10] was shown, that after the expenditure of antioxidant “Ionol’ in transformer oil, aging process is accompanying by paramagnetic centers formation, which lead to appearance of asphalt-tar compounds. Interactions of PC with diamagnetic molecules lead to formation of particles of dimensions 100-10 000 nm in UTO with maximum at 1000 nm (compare to 0.1 to 100 nm colloid structures with maximum at 5.5 nm). This particles become visible and change the color of FTO changed from yellow-green to red in UTO.
Dependences of spin-spin relaxation rates R2 = T2-1 from (tCP)-1 in the range 200-2000 ms are presented at figure 5.
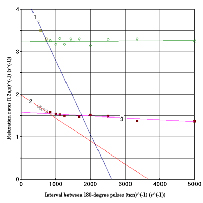
Figure 5. Dependences of Spin-Spin Relaxation Rates R2 = T2-1 from (tCP)-1 between 1800 Pulses Interval tCP in CPMG-Sequence. Curve 1 (□) – fresh TO for the tCP > 1600 ms, curve 2 () – used TO for the tCP > 1600 ms, curve 3 (■) – fresh TO for the tCP < 1600 ms, horizontal line with points (◊) - fresh TO for the tCP < 1600 ms
According to [11] the dependence for relaxation rate (Т2A)-1 = R2A for protons in one of proton phases must exist the following relation:
(Т2A)-1 = (Т2A0)-1 + РA РB(dw)2 tc [1- (2te/tCP)th(te/tCP)] (4)
where (Т2A0)-1 – relaxation rate in the absence of exchange, dw = dA - dB chemical shifts difference between “A” and ”B” – groups exchanging protons, te - average time of proton “living” in one position - exchange correlation time, and (te)-1 = (tA)-1 + (tB)-1, where tA and tB times of proton existence in the A and B positions. At tCP V 1600 ms the function th(tCP/2tc) in equation (4) can be neglected, so it transforms to:
R2A = (Т2A)-1 = (Т2A0)-1 + РAРB(dw)2te [1- (2te/tCP)] (5)
Or can be rewritten as:
R2A = [R2A0 + РAРB(dw)2te] - РAРB(dw)2te2/tCP (6)
Our measurements in the samples at fig.5 show, that in agreement with theory [11], the increase of relaxation rates R2A (curves 1 for pure TO and 2 for used TO) in both samples at tCP > 1600 ms is observed. For tcp-1 < 625 (s-1), tcp > 1600 ms exchange with correlation coefficient R2 = 0.93 and square mean error S = 0.055 the R2A for FTO and UTO are described by equations:
R2A = 4.52 – 0.00173/tCP (7)
R2A = 1.98 – 4.22×10⁻⁵/tCP (8)
Exchange processes are clearly seen at tcp-1 < 714 (s-1), tcp > 1400 ms, so we shall calculate exchange parameters in this range. For FTO from eq.(5) with R2A0 = 3.25, РAРB = 0.51×0.49 = 0.25 and eq.(6) with R2A0 = 1.37, РAРB = 0.05 we have the which give in FTO for tCP-1 > 625 s-1 te = 5.4×10⁻³ sec and dw = dA - dB = 0.153 ppm, which can be attributed to exchange between conformations of methylene (-C-CH2-C-) proton chains at dA = 1.4 and 1.25 ppm (1 ppm = 100 Hz) chemical shifts. For UTO R2A0 = 1.37, РAРB = 0.95×0.05 = 0.0475. So we have 1.37 + 0.0475 (dw)2te = 1.98 and 0.0475(dw)2te2 = 4.22×10⁻⁵, from which we obtain calculated te = 6.9×10⁻⁵ sec and dw = dA - dB = 4.4 ppm , which can be attributed to the fast exchange between new oxidized components (for instance R2-CH-COOH at dA » 2.6-2.8) and aromatic protons at dB = 7.1 ppm. This our results on chemical shift positions coincide with results of paper Kupareva, et al [8].
As to relaxation times, according obtained results, we can say, that Т2A = (R2A0)-1 = 307 ms can be attributed to methylene (-C-CH2-C-) proton chains at dA = 1.4-1.25 ppm in FTO. In UTO relaxation times Т2A = (R2A0)-1 = 730 ms can be attributed to R2-CH-COOH groups with dA » 2.6-2.8 (with mean amount РA = 0.51), measured Т2B = 98 ms with mean amount РA = 0.49 can be attributed to aromatic protons at dB = 6.9-7.9 ppm.
So can be made a conclusion that correlations between chemical characteristics of fresh and used oils can be used for optimization and upgrading technology of re-refining UTO by blending with the new additive packages. Can be selected the regulation and type of re-refining processes taking in consideration molecules in TO, between which exchange takes place.
There are no conflicts to declare.
- Mitchell Gladen LF, Chandrasecara TC, Fordham EJ (2014) Progr Nucl Magn Res Spectrosc 76: 1-60.
- ASTM D7171-05 (2011) Standard test method for hydrogen content of middle distillate petroleum products by low –resolution pulsed NMR-spectroscopy. Annual Book of ASTM standards 5: 7171-7205. [crossref]
- Каshaev RS (2018) Viscosity correlations with NMR relaxation in oil disperse systems. Appl Magn Reson 49. 309. [crossref]
- Nikolskaya E, Hiltunen Y (2018) Determination of carbon chain length of fatty acid mixtures by time domain NMR. Appl Magn Reson 49: 185-193. [crossref]
- Kurakina OE, Kozlov VK, Turanova OA, et al.(2018) Problemele energeticii regionale. Publons 2: 39-45. [crossref]
- Idiatullin ZSh, Каshaev RS, Темnikov АN (2007) Portable Relaxometer NMR. Patent of Russian Federation №74710.
- Каshaev RS, Idiatullin ZSh, Темnikov АN (2006) Thermostate device for samples in magnetic resonance probehead. Patent of Russian Federation № 2319138.
- Meiboom S., Gill D. (1958) Modified SpinEcho Method for Measuring Nuclear Relaxation Times. Rev Sci Instrum 29: 688. [crossref]
- Kupareva A, Maki-Arvela P, Grenman H, et al. (2013) Chemical characterization of Lub Oils. Energy and Fuels. 27: 27-34. [crossref]
- Камеnchuk JA (2007) Used oils and their regeneration. Thesis of dissertation. Tomsk.
- Luz Z, Meiboom S (1963) Nuclear Magnetic Resonance Study of the Protolysis of Trimethylammonium Ion in Aqueous Solution—Order of the Reaction with Respect to Solvent J Chem Phys 39: 386. [crossref]