Variations in the analysis of gamma-radioactivity records have a wide range of periods (from several minutes to a day or more), all spectra contain reliable periods of their own solar oscillations (up to 40 periods), long solar periods are also found in the oscillations of the Earth and the Moon. The discovered effects of the interaction of the neutrino flux with gamma radiation sources will allow a deeper study of the Sun, Earth's seismicity and other applied research. Further, this effect was called "anomalous neutrino radio - isotopic absorption", (ANRI effect). The study of periodicities is most effective in monitoring γ - radioactivity. When using the ANRI effect, it is very important to know the value of the neutrino capture cross section with radioactive elements. Two methods are used to determine - one is the Cavendish scale, the other is thermal. The consideration and application of these two completely different methods for estimating the capture cross section, taking into account the unusual nature of the recorded ANRI effect, has become extremely important. The torsional balance of the Cavendish KVK allowed experimentally determining the cross section for the capture of radioactive isotopes when exposed to a solar neutrino flux (~ 10–12). The results obtained allowed us to move on to a new study — the characteristic features of the interaction of the neutrino flux from a supernova burst, the Sun and the Earth, and special detectors.
Neutrino; ANRI – Effect; Astrophysics; Sun; Supernova Flash
It would seem that after such an event as a supernova outbreak, enough time has passed (~ 32 years) to determine and recognize the new, to give a forecast for the future. At the same time, the development of the science of neutrinos has undergone dramatic changes, which requires a detailed exposition. So, just in seismology [1] they began to receive results allowing us to draw the following conclusions: After the supernova explosion SN1987A 02/23/1987. Throughout the Earth, a statistically significant increase in the intensity of the earthquake flux was observed. At the same time, changes in the average and total seismic energy of earthquakes were noted, which depended on the physic mechanical characteristics of the enclosing massifs of rocks. In the geological structures of the Earth with low values of the velocities of bulk seismic waves (the earth's crust, a layer of low velocities), a statistically significant increase in the number of earthquakes was observed after the outbreak of SN1987A. Their average and total seismic energy increased. In the regions of the Earth with high values of the velocity of body waves (lithosphere mantle, intermediate zone, and phase transition zone), an average and total earthquake energy decreased after an outbreak. Good coincidence in time of the detected changes in the Earth's seismicity with the supernova burst SN1987A of 02.23.19.87. suggests that they are caused by the trigger action of the processes generated by this phenomenon.The applied technique is reliable and productive, promising for other applications.
The results obtained indicate the emergence and development of a seismic section of neutrino geophysics, which can give qualitative results on some parameters of the process of the impact of a flash on the Earth, as on an antenna. Continuous improvement of the equipment fleet of modern seismology is also necessary.
The neutrino effect, discovered only a little more than 5 years ago, inspires even more important hope [2; 3]. The existence of periodicities or simply disturbances in the level of radioactivity of various sources has been discovered for a long time. Thus, temporary variations of b radioactive decay (decay numbers) of Cs-137 were recorded in April 19–23, 1994. (Baurov Yu. A.) and other researchers. Temporal variations in the analysis of beta - radioactivity records have too long periods, and short ones are difficult to distinguish and are limited to several days or more. The one-year variation in the distance between the Sun and the Earth stands out well. Variations in the analysis of gamma-radioactivity records have a wide range of periods (from several minutes to a day or more), all spectra contain reliable periods of their own solar oscillations (up to 40 periods), long solar periods are also found in the oscillations of the Earth and the Moon. The discovered effects of the interaction of the neutrino flux with gamma radiation sources will allow a deeper study of the Sun, Earth's seismicity and other applied research. Further, this effect was called "anomalous neutrino radio - isotopic absorption", (ANRI effect). The study of periodicities is most effective in monitoring γ - radioactivity. When using the ANRI effect, it is very important to know the value of the neutrino capture cross section with radioactive elements. Two methods are used for determination - one is the Cavendish scale, the other is thermal [4]. The consideration and application of two completely different methods for estimating the capture cross section, taking into account the unusual nature of the recorded ANRI effect, has become extremely important. The implementation in the study of both methods allows us to consider the following. The Cavendish torsion balance (CEC) made it possible to experimentally determine the cross section for the capture of radioactive isotopes when exposed to a solar neutrino flux (~10–12).
KVK is a modern effective instrument for studying the interaction of neutrino fluxes and radioactive substances and other problems of nuclear and fundamental physics. Comparison of the capabilities, efficiency and cost of KVK and other modern research facilities (Hadron collider, tokomak, neutrino detectors or telescopes, gravitational antennas) leads to the conclusion that it is necessary to introduce an economic moratorium on the construction of insanely expensive, but fruitless research instruments and systems.The neutrino temperature sensor on the Baikal uranium ore showed adequacy to the estimates obtained on the torsion pendulum.
ANRI - the effect is applicable in all types of research and technology, the design of modern technology.Thus, to update studies on the seismic response spectrum of the SN1987A supernova flare and to better understand existing problems, new equipment and the ANRI - effect have appeared.
New Research of SN1987A Flash Data
In this situation, it is difficult to hope for an extensive update of observational data. But a deeper understanding and / or interpretation is both possible and necessary. To the real records, which in the future will be of scientific interest, we attribute the records of signals from the works [5; 6]. During registration, two reactions were used: the interaction of an electron antineutrino with a free proton (hydrogen atom) in the target and the conversion of the latter into a neutron and positron. And the second - the reaction of elastic scattering of neutrinos by electrons of a target, occurs with any type of neutrino. Both reactions are informative [6]. A somewhat abstract geophysical, very sensitive method based on nonlinear seismology also played its role [5; 7]. (Figure 1)
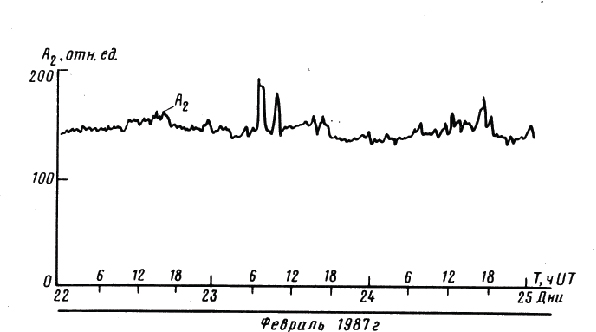
Figure 1. Variations in the Amplitude of the Second Harmonic of the Elastic Wave A2 in the Rock according to Local Time in the Period February 22-25, 1987y. [5]
Summary official data on the equipment used during registration (Table)
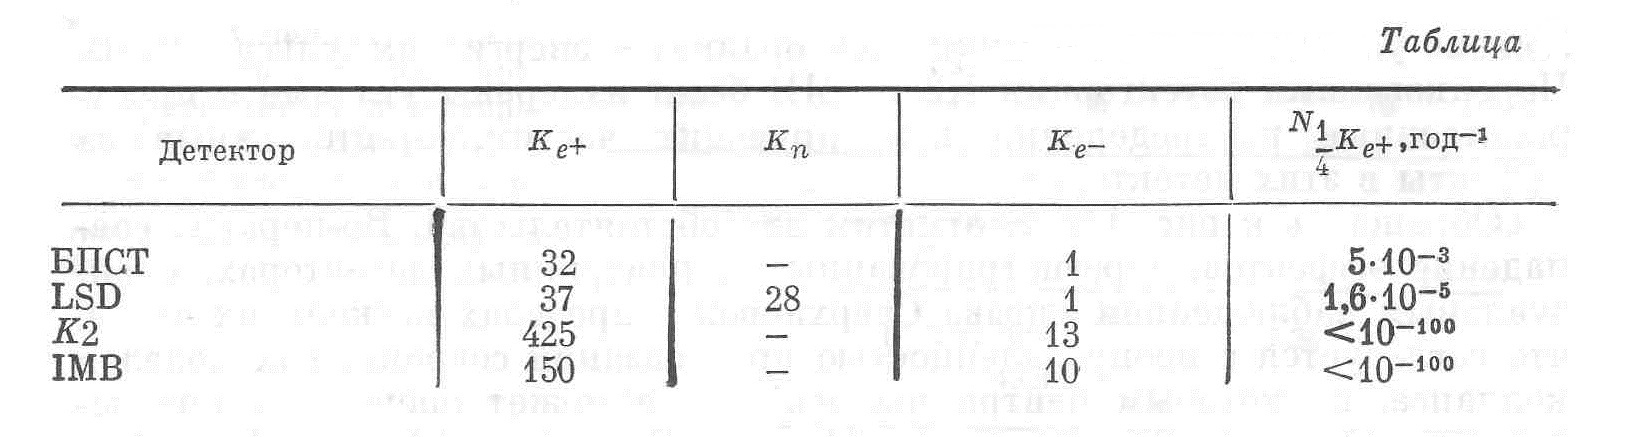
Detector, Table year
In the table: BPST - Baksan underground scintillation telescope, North Caucasus;
LSD - Liquid scintillation detector, Mont Blanc;
K2 - Cherenkov detector, Kamioka, gallery ;
IMB - Cherenkov Detector, Cleveland, Salt Mine. A description of the indicated observation equipment and its characteristics are given in [6].
February 23, 1987 at 10h 40m UT, the luminosity of one of the stars of the Big Magellan Cloud (BMO) galaxy suddenly increased, a supernova flared up at a distance of 52 kpc from the Earth (SN1987A). At the same time, signals were recorded on the above devices (Figure 2).
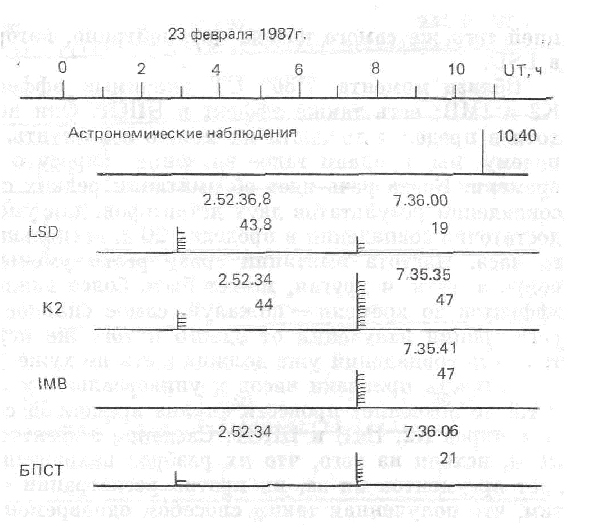
Figure 2. The Time Sequence of Recorded Events: on the Abscissa Axis - universal time; along the Ordinate Axis for Neutrino Detectors - the Number of Pulses in the Packet, next - the Arrival Time of the First and Last Pulse in the packet
As follows from Fig. 2, neutrino signals are noticeably ahead of optical ones by 3-5 hours; they are quite closely grouped near two points in time, 2h 52m and 7h 36m in UT. Next, the time and amplitude distribution of these pulses in neutrino detectors near these time instants is considered (Figure 3). Probably, the difference of these moments of time (4 hours 44 min or ΔТ ~ 5h) is a more important and characteristic parameter of the process of interaction of the neutrino flux from the flare with the Sun and the Earth. So, in the variations of the amplitude of the second harmonic of the elastic wave A2 in the rock according to local time in the period February 22-25, 1987y a seismic signal doubled in shape and clearly noticeable in amplitude is also observed with ΔТ ~ 5h [5].
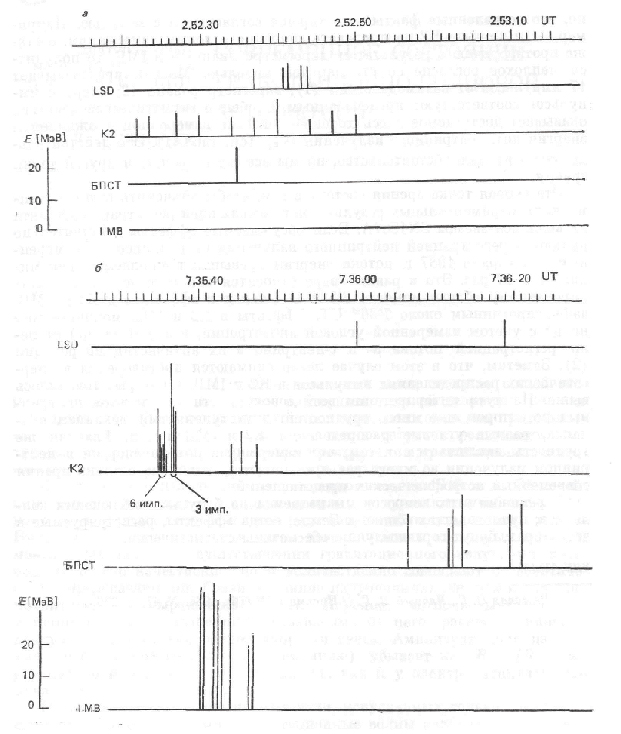
Figure 3. Temporal and Amplitude Distribution of Pulses in Neutrino Detectors near Time Points 2h 52m and 7h 36m in UT
A general analysis of the data presented clearly indicates the effect of neutrino fluxes at moments 2h 52m and 7h 36m by UT on detectors and on the Earth [1, 5]. However, the features of the detectors as well as their readings cause deep irreconcilable contradictions. The angular distributions of K2 and IBM are not consistent with the recorded flows; also effects in the K2, IBM, and BPST detectors near the time of 7h 36m. And most importantly - the existence of problems of energy estimates, double collapse, angular anisotropy. Before looking for new or more modern answers, we turn to the results of studies of previous years that were previously out of the attention of specialists [7]. So, back in 2003 it was proposed the introduction of the concept of a single laboratory, the Earth and / or the helio - geophysical factor, which calls into question the reliability of the coincidence patterns within the Earth, for example, the independence of the energy states of the gravitational antennas of Rome and Maryland [8]. Let us consider how expressed this independence is (Figure 4).
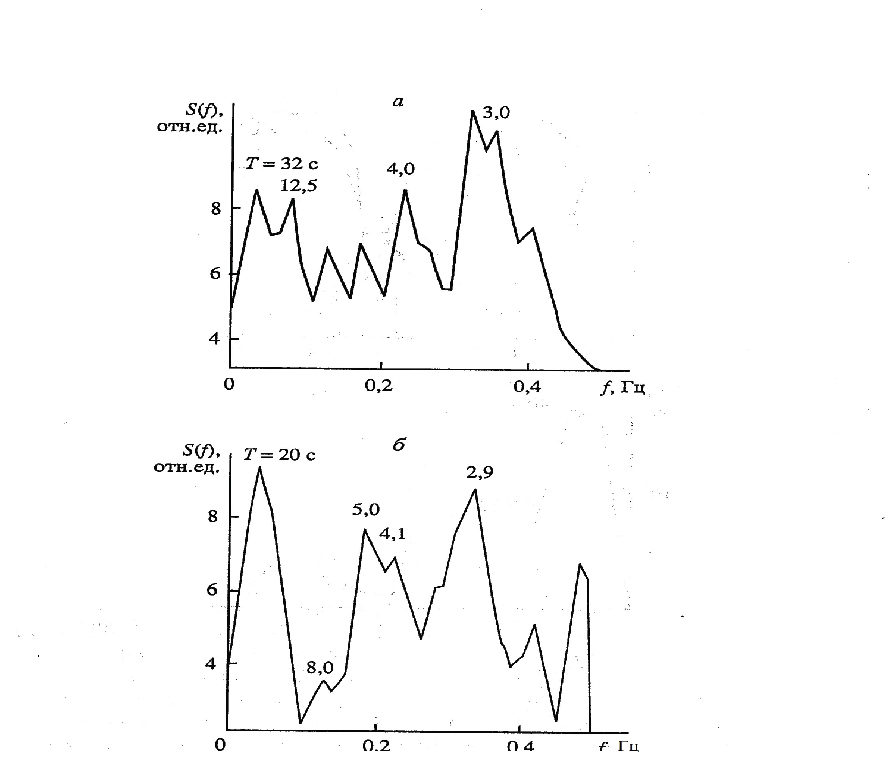
Figure 4. Spectra of Temporal Variations in the Energy Level of the Gravitational Antennas of Maryland (a) and Rome (b) [7]
On the spectra of temporal variations (Figure 4), there are peaks with periods T in the region of 3, 4, 12, 20 sec, which are characteristic of a micro seismic field excited or associated with hydrometeor processes in the Atlantic. Moreover, peaks at T ~ 3 sec. dominate in the longer wave length region T ~ 20-30 sec. There are also areas that can make a significant correlation in the "independent" readings of both gravitational antennas. The correlation between events at the Mont Blanc neutrino detector and the energy state of antennas and a comparison of the level of correlation with seismic events on Earth (Figure 5a) indicate an increase in correlation during earthquakes.
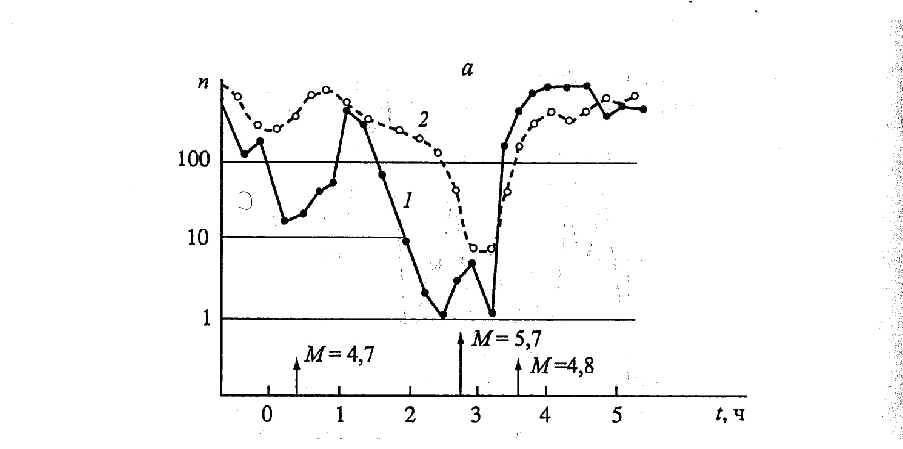 Figure 5a.
 Graphs representing the Correlation Coefficient between Events at the Mont Blanc Neutrino Detector and the Energy State of the Gravitational Antennas of Rome (1) and Maryland (2) [8]
In Figure 5a, the arrows indicate the earthquakes of February 23, 1987. with magnitude M; n - is the number inverse to the correlation coefficient. Taking into account the time of arrival of seismic waves from the focal zones to the detectors of Rome, Maryland and Mont - Blanc, the most powerful earthquake coincides with the moment of registration of a group of neutrino signals (2 hours. 52 min), the effect of which on radioactive geological structures served as the trigger action for the earthquake. (Figure 5b, Figure 5c, Figure 6)
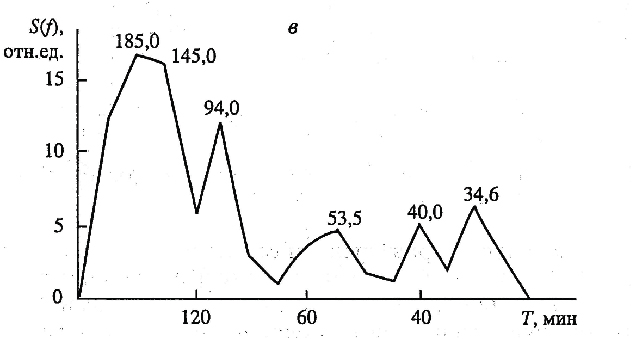
Figure 5b. Spectrum of Time Variations of the Coefficient Correlation according to the Data of the Rome Gravitational Antenna
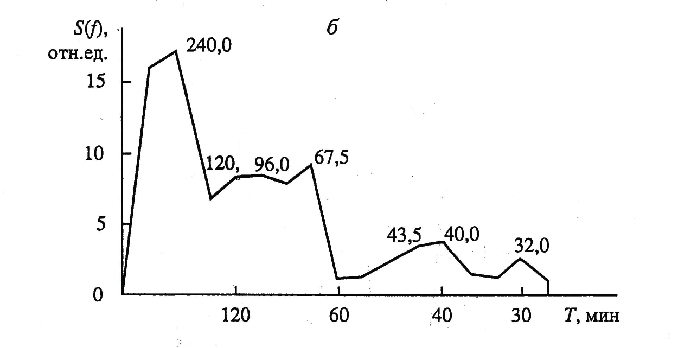
Figure 5c. Spectrum of Time Variations of the Coefficient Correlation according to the Data of the Maryland Gravitational Antenna
In the spectra of Figure 5b, c and Figure 6, peaks are marked, which are further compared with periods of solar oscillations (see Table 1).
Table 1. Spectral Peaks of the Signals of the Rome and Maryland Detectors in Comparison with the Periods of Solar Oscillations
Period min
Detectors |
Period min
Sun |
Mode |
240 |
120,2 |
2*g7 |
185 |
175,9 |
g16, l3 |
145 |
145,9 |
g9, l2 |
120 |
120,2 |
g7, l2 |
96 |
95,38 |
g5 l2 |
94 |
95,38 |
g5 |
67,5 |
67,76 |
g4, l3 |
53,5 |
54,88 |
g2, l3 |
43,5 |
42,5 |
p1, l2 |
40; 40 |
40,97 40,94 |
f p2 l0 |
34,6 |
36.98 |
p2 l1 |
32 |
32,19 |
Р2,l3 |
Figure 5b, c and Figure 6 give spectral representations of the energy state of the antennas of Rome and Maryland at the time of exposure to a supernova flash (see Table 1). As follows from the data on the response of the antennas, their response to the flare contains periodicities that are in good agreement with the durations of the Sun's own oscillations (see Table 2). Some of the mismatching periodicities are multiple sub harmonics of solar oscillations as well. This is characteristic of an energetically active wave system, such as the Sun, in the case of strong external excitation. That is, the neutrino flux of a supernova simultaneously with the Earth acted on the Sun, on its active core. The response of the nucleus could not be instant, both due to the size and mechanism and energy of the neutrino flow of the flare, which led some researchers on Earth to the double flare hypothesis. However, if we take into account the ANRI absorption effect [2-4], then the observation on the detectors of two exposure times 2h 52m and 7h 36m in UT is quite natural, and the interval ΔТ ~ 5h is caused by the internal processes of the solar core under the influence of the neutrino flux effect through the ANRI mechanism from a supernova outburst (Fig. 7). This also explains not only the time 7h 36m, but also the radiation pattern of a part of the neutrino flux. Since the Henry effect was previously considered only on a purely laboratory scale, the flare case leads to astrophysical dimensions and requires a separate consideration, taking into account the already known results [10].
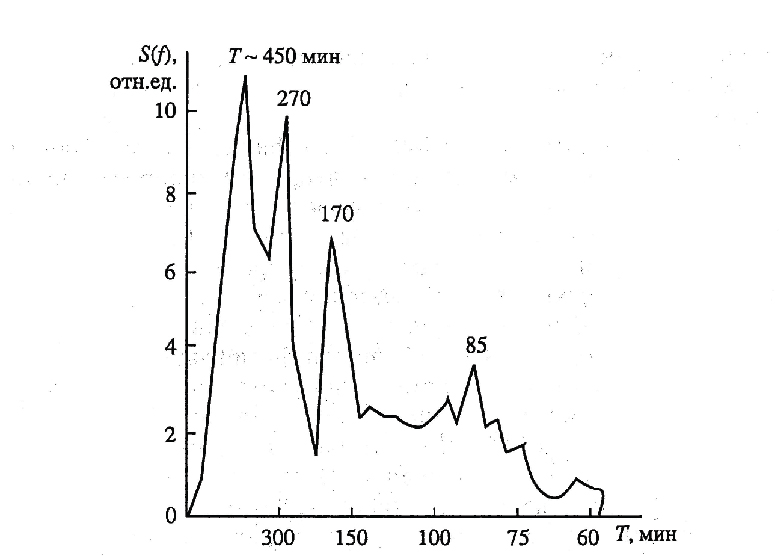
Figure 6. Spectrum of Time Variations of the Correlation Coefficient according to the Total Energy State of the Gravitational Antennas of Rome and Maryland (recording time18hours)
Table 2. Periods of Solar Oscillations for the Standard Model of the Sun [9]
Mode |
Period, min |
Mode |
Period, min |
l=0 |
l=1 |
l=2 |
l=3 |
l=4 |
l=1 |
l=2 |
l=3 |
l=4 |
p1 |
62,29 |
57,25 |
42,50 |
39,53 |
37,58 |
f |
|
45,90 |
40,97 |
38,82 |
p2 |
40,94 |
36,98 |
32,19 |
29,42 |
27,62 |
g1 |
61,58 |
55,05 |
47,94 |
44,18 |
24,49 |
30,93 |
27,88 |
25,09 |
23,21 |
21,92 |
g2 |
84,4 |
63,03 |
54,88 |
49,59 |
20,19 |
24,49 |
22,30 |
20,52 |
19,26 |
18,31 |
g3 |
105,8 |
72,58 |
61,88 |
57,73 |
17,17 |
20,19 |
18,68 |
17,39 |
16,44 |
15,72 |
g4 |
127,3 |
83,49 |
67,76 |
61,11 |
14,93 |
17,17 |
16,04 |
15,10 |
14,38 |
14,81 |
g5 |
149,2 |
95,38 |
74,9 |
64,89 |
13,21 |
14,93 |
14,08 |
13,35 |
12,77 |
12,32 |
g6 |
171,1 |
107,7 |
83,1 |
70,30 |
11,86 |
13,21 |
12,55 |
11,97 |
11,51 |
11,14 |
g7 |
|
120,2 |
91,8 |
76,83 |
10,78 |
11,86 |
11,34 |
10,87 |
10,49 |
10,18 |
g8 |
|
132,9 |
100,7 |
83,62 |
9,90 |
10,78 |
10,35 |
9,97 |
9,65 |
9,39 |
g9 |
|
145,9 |
109,7 |
90,56 |
9,15 |
9,90 |
9,54 |
9,21 |
8,94 |
8,71 |
g10 |
|
158,9 |
118,9 |
97,62 |
8,50 |
9,15 |
8,84 |
8,56 |
8,32 |
8,11 |
g11 |
|
172,1 |
128,1 |
104,5 |
7,94 |
8,50 |
8,23 |
7,99 |
7,78 |
7,60 |
g12 |
|
|
137,6 |
111,7 |
7,45 |
7,94 |
7,71 |
7,49 |
7,31 |
7,15 |
g13 |
|
|
147,0 |
118,9 |
7,02 |
7,45 |
7,25 |
7,06 |
6,89 |
6,75 |
g14 |
|
|
156,5 |
126,5 |
p16 |
7,02 |
6,84 |
6,67 |
6,52 |
6,39 |
g15 |
|
|
166,7 |
133,3 |
p17 |
6,64 |
6,47 |
6,32 |
6,18 |
6,06 |
g16 |
|
|
175,9 |
141,5 |
p18 |
6,29 |
6,14 |
6,00 |
5,87 |
5,77 |
g17 |
|
|
|
148,6 |
p19 |
5,98 |
5,84 |
5,71 |
5,60 |
5,50 |
g18 |
|
|
|
156,4 |
p20 |
5,69 |
5,56 |
5,45 |
5,34 |
5,25 |
g19 |
|
|
|
164,0 |
|
|
|
|
|
|
g20 |
|
|
|
171,1 |
p, g, f — vibration modes; l - forms of vibration
Figure 5b, c and Figure 6 give spectral representations of the energy state of the antennas of Rome and Maryland at the time of exposure to a supernova flash (see Table 1). As follows from the data on the response of the antennas, their response to the flare contains periodicities that are in good agreement with the durations of the Sun's own oscillations (see Table 2). Some of the mismatching periodicities are multiple sub harmonics of solar oscillations as well. This is characteristic of an energetically active wave system, such as the Sun, in the case of strong external excitation. That is, the neutrino flux of a supernova simultaneously with the Earth acted on the Sun, on its active core. The response of the nucleus could not be instant, both due to the size and mechanism and energy of the neutrino flow of the flare, which led some researchers on Earth to the double flare hypothesis. However, if we take into account the ANRI absorption effect [2-4], then the observation on the detectors of two exposure times 2h 52m and 7h 36m in UT is quite natural, and the interval ΔТ ~ 5h is caused by the internal processes of the solar core under the influence of the neutrino flux effect through the ANRI mechanism from a supernova outburst (Figure 7). This also explains not only the time 7h 36m, but also the radiation pattern of a part of the neutrino flux. Since the Henry effect was previously considered only on a purely laboratory scale, the flare case leads to astrophysical dimensions and requires a separate consideration, taking into account the already known results [10]. As many researchers noted, for example, Bryushinkin [15], the Sun was at a minimum of activity before the flare, and the appearance of spots was noted only on February 14; after the February 23 outbreak, spots appeared two days later (Fig. 8a), and from that day, solar activity began to increase to ~ 50 times (Figure 7a) and by 2 orders of magnitude when compared with annual data (Figure 7b).
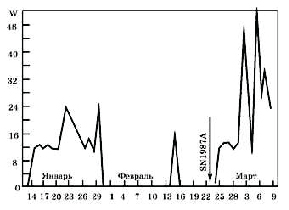
Figure 7a. Wolf Numbers for January – March 1987 (‘Solar Data’ magazine)
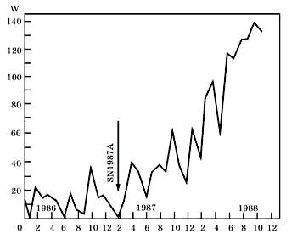
Figure 7b. Data on Wolf Numbers for 1986–1988 y. (‘Solar Data’ magazine)
As is known, the neutrino flux strongly depends on the activity of the Sun, and its power largely determines the activation of the volcanic process [11]. A joint examination of the data in Fig. 8 indicates that the increase in the number of Wolf numbers, that is, the activity of the Sun, and therefore the increase in solar neutrino fluxes, increased strongly (by 1-2 orders of magnitude) under the influence of a supernova burst. This means that the Sun is a detector of external neutrino fluxes, that is, ANRI exists - an effect of cosmic scale. The same effect is associated with the registration of a second, “inexplicable” flare (at 7h 36m UT), as well as another beam pattern, unlike the first flash. Indeed, if the first flare came from the Large Magellan Cloud at (2h 52m UT), then the second from the Sun at (7h 36m UT) - naturally radiation patterns in the general case are always different. The difference in the arrival times of the flare sections is ~ 5.0 hours for both recordings with traditional instruments [6, 8] and the purely geophysical method [5]. Moreover, this 5-hour section for case [5] does not coincide in time with case [6.8], which is probably mainly determined by the energy state of the region of registration. Preliminarily, it can be assumed that a 5-hour time span determines the time of relaxation and reemission by the solar core of the action of a neutrino burst from a supernova, as well as the beginning of the impact on the Earth of neutrino fluxes of the Sun modulated at the frequencies of its own oscillations (Fig. 5, 6) [7] but this requires non-standard research. This is possible with a detailed analysis, but with other geophysical parameters, such effects were not noted [15].The authors consider it their duty to note the historical contribution to the solution of the problem of registration of a supernova outbreak by authors [6], who not only developed their own original equipment, but showed the rare wisdom of scientists who preserved other people's experimental data, which did not contribute to the efficiency of their work. This is difficult to say about their colleagues who, using the ANRI effect and the principles of the neutrino telescope [16] without reference, use other people's scientific ideas as their own.
- Tarasov NT, Tarasova NV, Khavroshkin OB, et al. (2016) Supernova burst SN1987A: seismic response. Eng Phys 6: 82-93. [crossref]
- Khavroshkin OB, Tsyplakov VV (2017) Cavendish Torsion Balance and Hadron Collider at the Cern: Different Fates and Results. SF J Nucl Sci. [crossref]
- Khavroshkin OB, Tsyplakov VV (2018) Devices for advanced physics research. IJRTEM 2 : 59-63. [crossref]
- Khavroshkin OB, Tsyplakov VV (2019) Anomalous Neutrin Radioisotopic (Anri) Absorption: Capture Section. IJAPM 1: 3-7. [crossref]
- Yu. Vavilov N, Verbitsky TZ, Khavroshkin OB (1989) Analysis of the testimony of an underground acoustic device. JETP 50: 411-412.
- Zatsepin GT, Dadykin VL, Ryazhskaya OG (1988) Search for neutrino radiation from gravitational collapse of stars: expectations and reality. Bulletin of the Academy of Sciences of the USSR, , Vestn Akad Nauk 9: 47-57. [crossref]
- Khavroshkin OB, Tsyplakov VV (2003) New problems of extraterrestrial seismology. Sat scientific Proceedings Problems of Geophysics of the XXI Century. ed. A.V. Nikolaev. Prince 2: 281-324.
- Aglietta G, Badino G, Bologna G. et al. (1989) Analysis of data recorded by the Mont Blan neutrino detector and by the Maryland and Roma gravitation - wave detectors during SN 1987A . Nuovo cim C 12: 75-103. [crossref]
- Iben I Jr, Mahaffy J (1976) Astrophys J Lett 209: 39.
- Khavroshkin O, Tsyplakov V (2013) Sun, Earth, radioactive ore: common periodicity. NS 5: 1001-1005. [crossref]
- Fedotov SA, Khavroshkin OB, Tsyplakov VV, et al. (2016) Solar and astrophysical factor, Z-variations of GPS data of calderas and volcanoes: the mechanism of their interaction. IJAPM 6: 57-64.
- Oleg Khavroshkin, Vladislav Tsyplakov (2013) Sun, Earth, radioactive ore: common periodicity. NS 5: 1001 -1005. [crossref]
- Khavroshkin OB, Tsyplakov VV (2018) Earth: Seismic Fields, Volcanoes, Solar and Astrophysical Neutrino Fluxes. SF J Astrophysics 1: 34. [crossref]
- Khavroshkin OB, Fedotov SA, Tsyplakov VV, et al. (2019) Volcanology And The New Geophysics: Reality And Prospects On The Example Of The Yelloustonian Volcano. Volcanology and Seismology 1: 25–35. [crossref]
- Bryushinkin SM ( ) Supernova explosion shook the Sun Earth. THE INTERNET.
- Khavroshkin OB, Tsyplakov VV (2018) Neutrino Telescope: Problems and Solution. SF J Astrophysics 1: 1-11. [crossref]